Technical2026-10-27
Solar irrigation pumping must be sized from daily crop-water demand, total dynamic head and the solar resource in the same month. Panel wattage by itself does not state how many cubic metres will reach a field. A defensible design identifies the month with the highest water burden relative to available solar energy, checks the pump on a supplier curve at that head, and then proves the result with synchronized flow, head, irradiance and storage records.
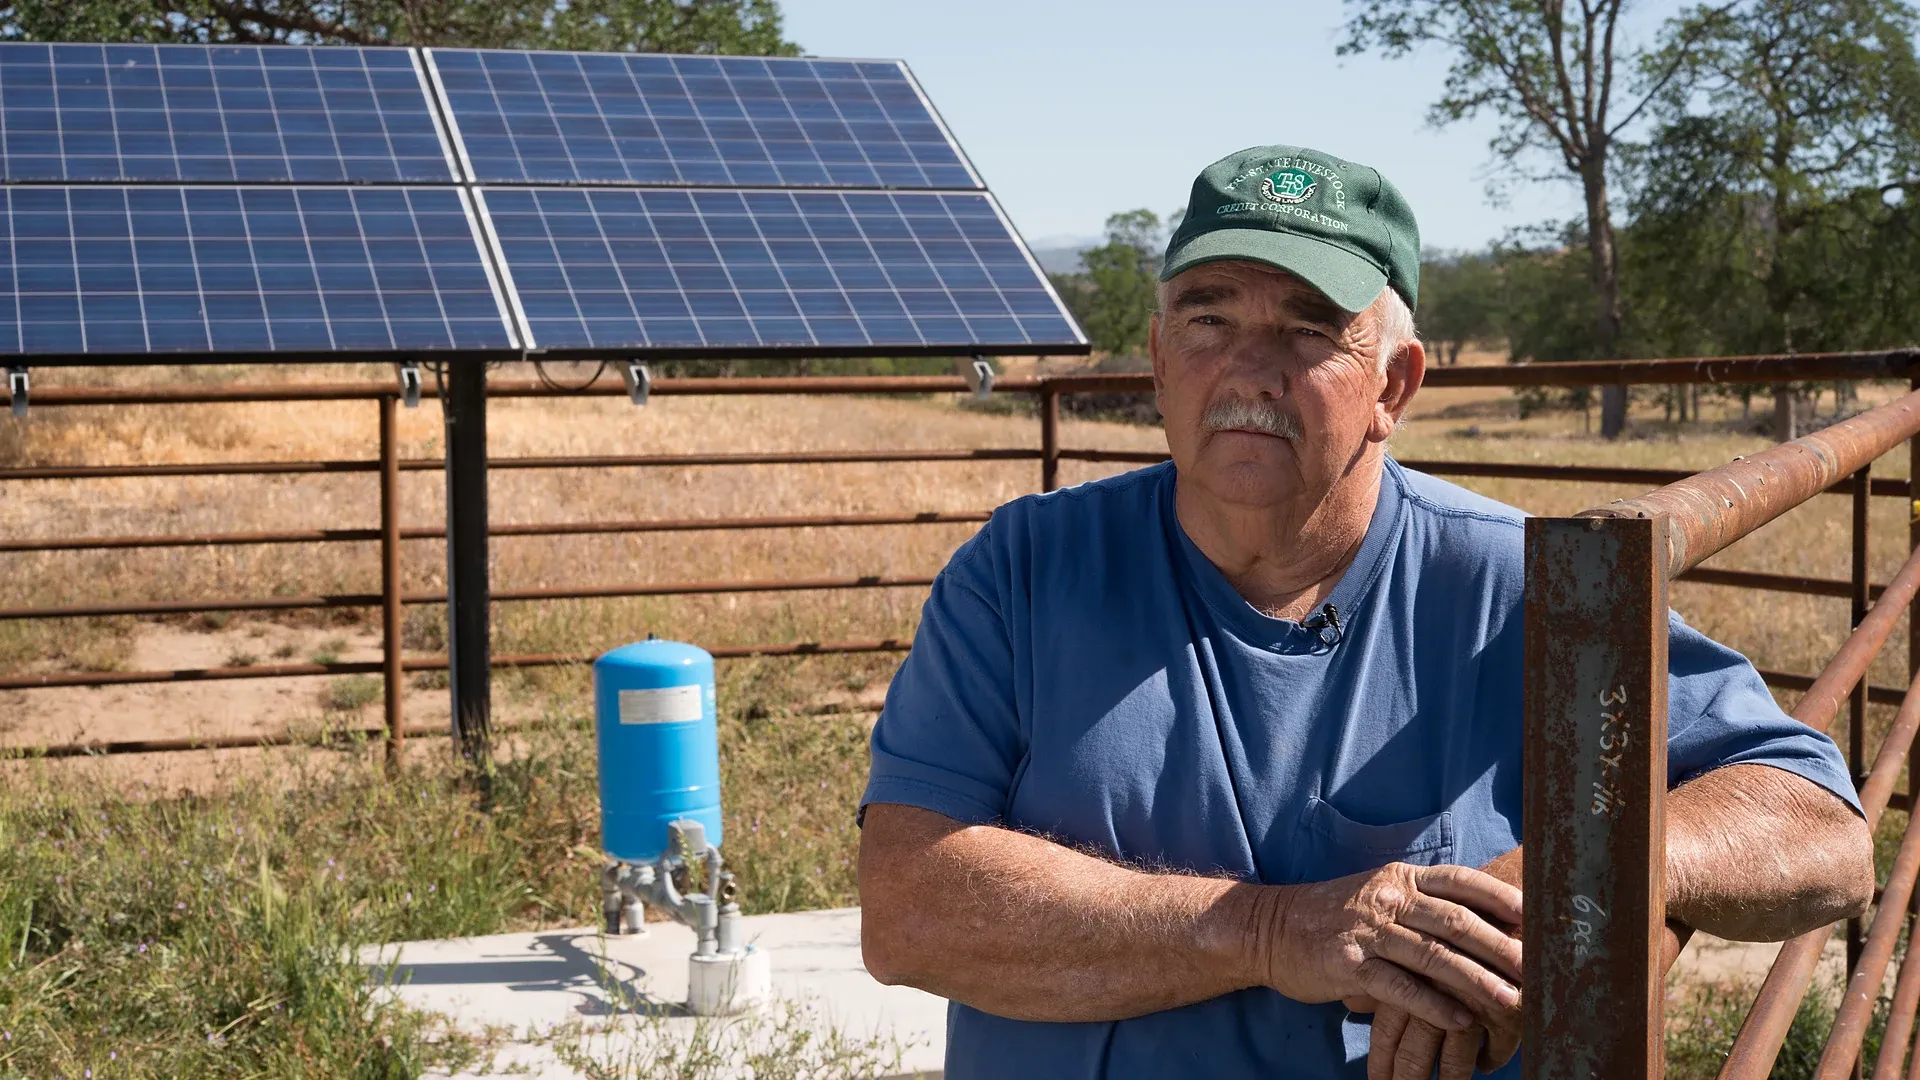
The field photograph shows a real photovoltaic array and wellhead pressure equipment used for agricultural watering. The image documents relevant equipment; it does not validate a particular array size, pump output or storage volume.
This guide builds a transparent seasonal worksheet for a solar irrigation pump. It covers direct pumping and systems with a water tank or reservoir. Values in the examples are illustrative, so replace them with crop, climate, source, pipeline and equipment data from the actual project.
Define the delivery boundary first: crop area, net irrigation depth, application efficiency, irrigation days per week, available pumping window and the pressure required at a named field node. Then state the water source, seasonal water level, elevation change, pipe route, filter state and permitted zone combinations. This prevents a panel quotation from becoming an accidental hydraulic specification.
To maximize daily water delivery under fluctuating diurnal irradiance curves, engineers install photovoltaic brushless centrifugal surface pumps capable of operating directly from DC solar array strings.
Use the irrigation pump sizing method for flow and total dynamic head to establish the hydraulic job. Keep daily volume and instantaneous flow separate. A crop may need 120 m³/day, but a six-hour solar pumping window requires an average of 20 m³/h before storage, downtime or variability allowances are considered.
One millimetre of water over one hectare equals 10 m³. If the net crop requirement is d millimetres per day over area A hectares, net volume is Vnet = 10 × d × A. Divide by the measured or defensibly estimated application efficiency E to obtain gross field volume: Vgross = Vnet / E. Add separately measured filter flushing, line flushing and other legitimate uses; do not hide them inside a vague safety factor.
A 3 ha block requiring 3.2 mm/day has a net demand of 96 m³/day. At 88% application efficiency, gross crop delivery is 109.1 m³/day. If documented flushing averages 5 m³/day, the planning duty is 114.1 m³/day. If irrigation is allowed on only six days each week, the operating-day target becomes 133.1 m³ rather than 114.1 m³. This calendar conversion often changes the pump and storage decision more than a small panel adjustment.
For every month, place gross daily irrigation demand beside the site’s solar resource on the same time basis. Monthly mean daily peak-sun hours are useful for an early screen, while a final design needs a data source, plane-of-array assumptions, temperature losses and an agreed reliability basis. The FAO treatment of solar water lifting explains that an irrigation system should be sized for the critical month: the period most heavily loaded relative to available solar energy. It need not be the sunniest month or the month with the lowest sunshine.
Irrigation automation schedules high-demand blocks during mid-day solar peaks by actuating low-wattage pilot-operated diaphragm valves that consume minimal electrical holding current.
| Month | Gross irrigation (m³/day) | Peak-sun hours/day | Demand / sun (m³ per peak-sun hour) | Design reading |
|---|---|---|---|---|
| Jan | 0 | 3.2 | 0 | Dormant |
| Feb | 0 | 3.8 | 0 | Dormant |
| Mar | 25 | 4.7 | 5.3 | Low duty |
| Apr | 55 | 5.8 | 9.5 | Rising |
| May | 95 | 6.4 | 14.8 | High |
| Jun | 125 | 6.2 | 20.2 | Critical |
| Jul | 135 | 6.9 | 19.6 | Near-critical |
| Aug | 120 | 6.5 | 18.5 | High |
| Sep | 80 | 5.4 | 14.8 | Falling |
| Oct | 35 | 4.3 | 8.1 | Low |
| Nov | 0 | 3.4 | 0 | Dormant |
| Dec | 0 | 2.9 | 0 | Dormant |
In this example July needs more water, but June has the larger demand-to-sun ratio and is the first critical-month candidate. This ratio is a screening indicator, not a pump output equation. Temperature, array orientation, controller limits, head changes and the supplier’s performance data still have to be applied.
Total dynamic head combines dynamic source lift, elevation to the delivery node, required pressure head and friction through pipes, fittings, valves and treatment equipment. For a well, use pumping water level rather than static water level. For a reservoir, include expected drawdown. Calculate clean and credible dirty-filter cases and identify the path that governs each zone.
The drip irrigation pressure budget helps allocate each loss. Do not add the same pressure twice: if the delivery pressure already includes a regulator or elevation boundary, document exactly where the calculation begins and ends. A seasonal fall in water level can make the hydraulic critical month differ from the crop-demand peak.
The product of daily volume and total dynamic head, expressed as m⁴/day, is a convenient hydraulic-load index for comparing months. Hydraulic energy is Ehyd = ρgVH; in practical SI units, Ehyd (kWh/day) = V(m³/day) × H(m) × 9.81 / 3,600. Divide by combined pump, motor, controller and wiring efficiency to estimate required electrical energy at the stated duty.
At 125 m³/day and 42 m TDH, hydraulic energy is 14.3 kWh/day. If a preliminary combined wire-to-water efficiency is 48%, the input-energy screen is 29.8 kWh/day. This is not an array size. It is an auditable bridge between the water duty and the equipment model. The efficiency must later come from curves or measured data at the operating point, not from a generic best-case label.
Request daily and hourly water output across the relevant head range and solar input, plus controller, motor and pump limits. Confirm whether the published daily figure assumes a named location, fixed array size, annual average, clear sky or a particular tracking arrangement. A daily average at one location cannot be copied into another site’s seasonal design.
Use the pump-curve operating-point guide to check where the pump meets the system curve. Verify minimum flow, maximum head, motor current, source constraints and acceptable operating envelope. Panel nameplate power cannot predict delivered volume because irradiance, cell temperature, controller behaviour, pump efficiency and head all act between the array and the meter.
Direct pumping can reduce civil works when irrigation demand follows the solar window and zones can accept variable flow within their hydraulic limits. Storage decouples pumping from irrigation: the pump can follow daylight while the field receives a controlled schedule. Storage can also bridge short cloudy periods, but it adds evaporation, water-quality, structural, safety and level-control requirements.
Do not ask only “How many days of storage?” Define the starting usable volume, minimum reserve, pump inflow by day, irrigation withdrawal, spill, evaporation or other losses, and the rule for supplemental supply. Model sequences, because two moderate cloudy days can be more important than one design average.
| Day | Opening storage (m³) | Pumped (m³) | Irrigation withdrawal (m³) | Spill / other loss (m³) | Closing storage (m³) |
|---|---|---|---|---|---|
| Clear | 80 | 145 | 125 | 0 | 100 |
| Cloudy | 100 | 72 | 125 | 0 | 47 |
| Cloudy | 47 | 55 | 125 | 0 | -23 → reserve or supplement required |
The negative closing value is a visible failure, not a number to round away. The design needs at least 23 m³ of additional usable water for this sequence, a reduced withdrawal, a larger verified solar-pump yield, or a defined supplemental source. Apply dead storage and operating level limits before calling tank geometry “usable capacity.”
Confirm module count, series voltage at the coldest expected condition, operating voltage at high cell temperature, controller input window, current limits, motor starting method, cable length, conductor loss, isolation, earthing, surge protection and enclosure environment. Array shade should be assessed through the pumping season and throughout the intended operating window, not only at noon on one clear day.
A tracker or oversized array may extend pumping hours, but the controller can clip power and the pump still cannot exceed its hydraulic envelope. Record assumptions about soiling, cleaning interval, module degradation and downtime. Electrical selection and energized work belong to qualified personnel following local rules and equipment instructions.
A solar pump cannot deliver a seasonal plan if the source cannot sustain the instantaneous abstraction. For wells, log static level, dynamic level, drawdown, recovery and any legal or operational abstraction limit. For canals or ponds, record intake submergence, debris, seasonal level and screen loss. Coordinate source protection with dry-run, low-level and flow-loss logic.
Measure volume with a properly selected irrigation water meter. Controller energy or runtime is not a substitute for delivered water. If water level falls during the season, recalculate TDH and read the curve again; the same solar input will then produce a different flow.
Before testing, verify meter units, pressure references, water-level datum, tank level-to-volume conversion, time zone and controller clock. Use one interval and timestamp basis for irradiance, source level, pressure, flow, volume, electrical power, controller state and storage change. Otherwise a cloud event, valve transition and flow reduction can appear to be unrelated.
| Timestamped field | Instrument or source | Why it must share the same interval | Acceptance question |
|---|---|---|---|
| Plane-of-array irradiance | Reference cell or reviewed station | Defines the energy reaching the array | Was low flow caused by low sun? |
| Dynamic water level | Level probe / sounding | Changes total dynamic head while pumping | Did source drawdown raise the duty? |
| Suction and discharge pressure | Verified gauges or transducers | Reconstructs pump head | Is the pump on the expected curve? |
| Flow and interval volume | Verified water meter | Separates instantaneous rate from delivered water | Was the daily volume achieved? |
| DC/AC power and controller state | Controller log and power meter | Explains clipping, limiting and trips | Was available power converted into pumping? |
| Tank level / storage change | Level-to-volume curve | Closes the water balance | Does metered flow agree with stored and withdrawn water? |
Test a clear day, a variable-cloud day and representative zone duties. Compare measured daily volume with the supplier prediction at measured head and irradiance. Investigate persistent differences through shading, soiling, water-level change, pressure loss, meter error, controller limiting and pump condition before changing setpoints.
For each month, retain expected gross volume, head range, pump hours, solar input basis, storage floor and permitted supplemental water. Set alert bands from measurement uncertainty and normal variability. One low-flow interval under cloud is not automatically a fault; repeated failure to meet daily volume at adequate irradiance and normal head is a stronger diagnostic signal.
Use a reviewed farm weather station audit when local solar radiation supports performance review. Separate weather evidence from crop scheduling: radiation helps explain available power, while crop demand still depends on crop stage, weather, soil, rooting and the irrigation strategy.
The acceptance result is a measured water service: the required daily cubic metres reach the defined pressure boundary through the critical season while source, pump, controller, array and storage limits remain respected. Keeping every assumption in one auditable water-energy balance makes later expansion and fault diagnosis far safer than relying on panel watts alone.
$$E_{\text{hyd}} (\text{kWh/day}) = \frac{V (\text{m}^3/\text{day}) \times H (\text{m}) \times 9.81}{3600} = \frac{V \times H}{367}$$ where $V$ is required daily crop water volume in $m^3$ and $H$ is total dynamic head in meters.
Chemical batteries add 40% to capital costs, degrade rapidly under high desert ambient heat, and require replacement every 4–6 years. Pumping water into an elevated tank converts solar energy directly into potential energy at near-zero maintenance.
To account for high-temperature PV derating (panels lose ~0.4% efficiency per °C above 25°C), dust accumulation, and to extend operating hours into early morning and late afternoon when solar irradiance is low.
The MPPT controller dynamically adjusts motor frequency and speed within milliseconds to hold solar panel voltage at its peak power point ($V_{mp}$), allowing the pump to continue delivering water at reduced speed rather than stalling.
Products relevant to this irrigation guide.
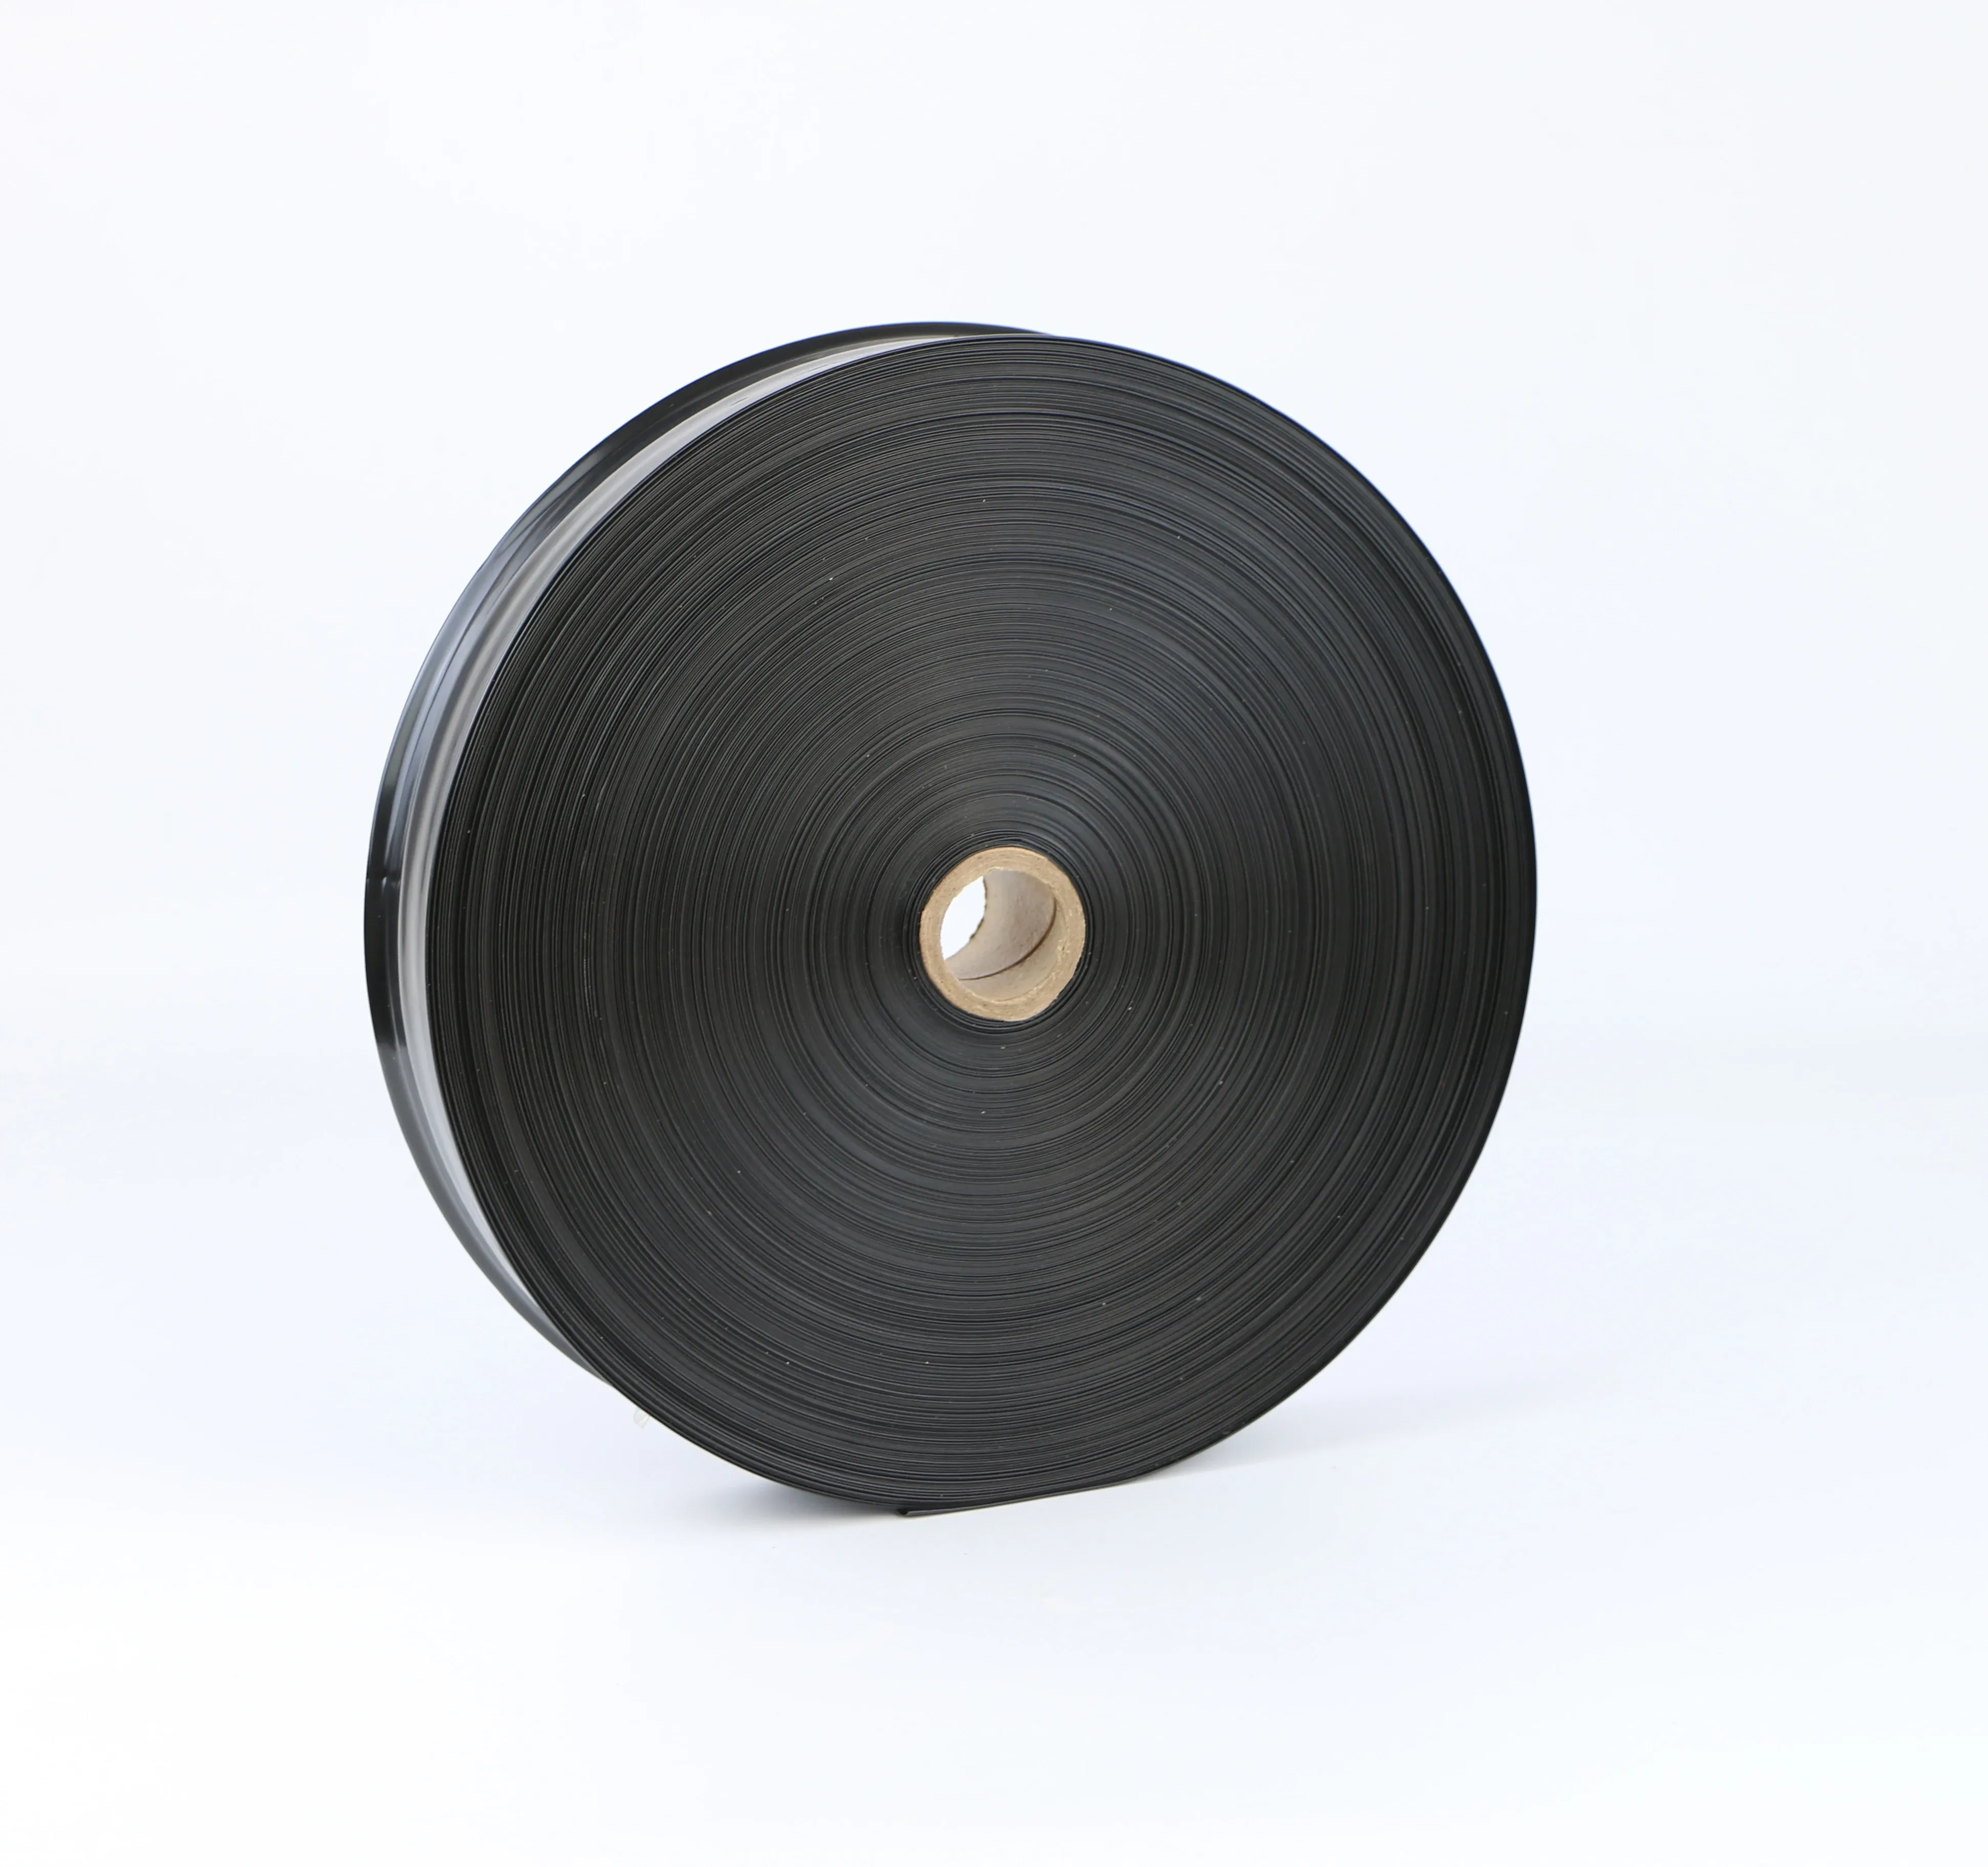
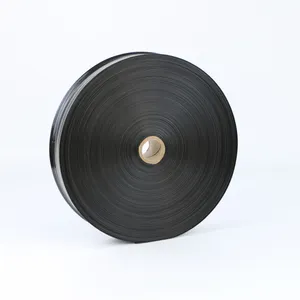
IRRINEX layflat irrigation hose. Diameter: 75mm; Thickness: 1.0mm; Diameter: 75*1.0mm; Roll length: 100m. Layflat hose conveys water within an irrigation arrangement. Select the material, dimensions and connection configuration from the exact listing data.
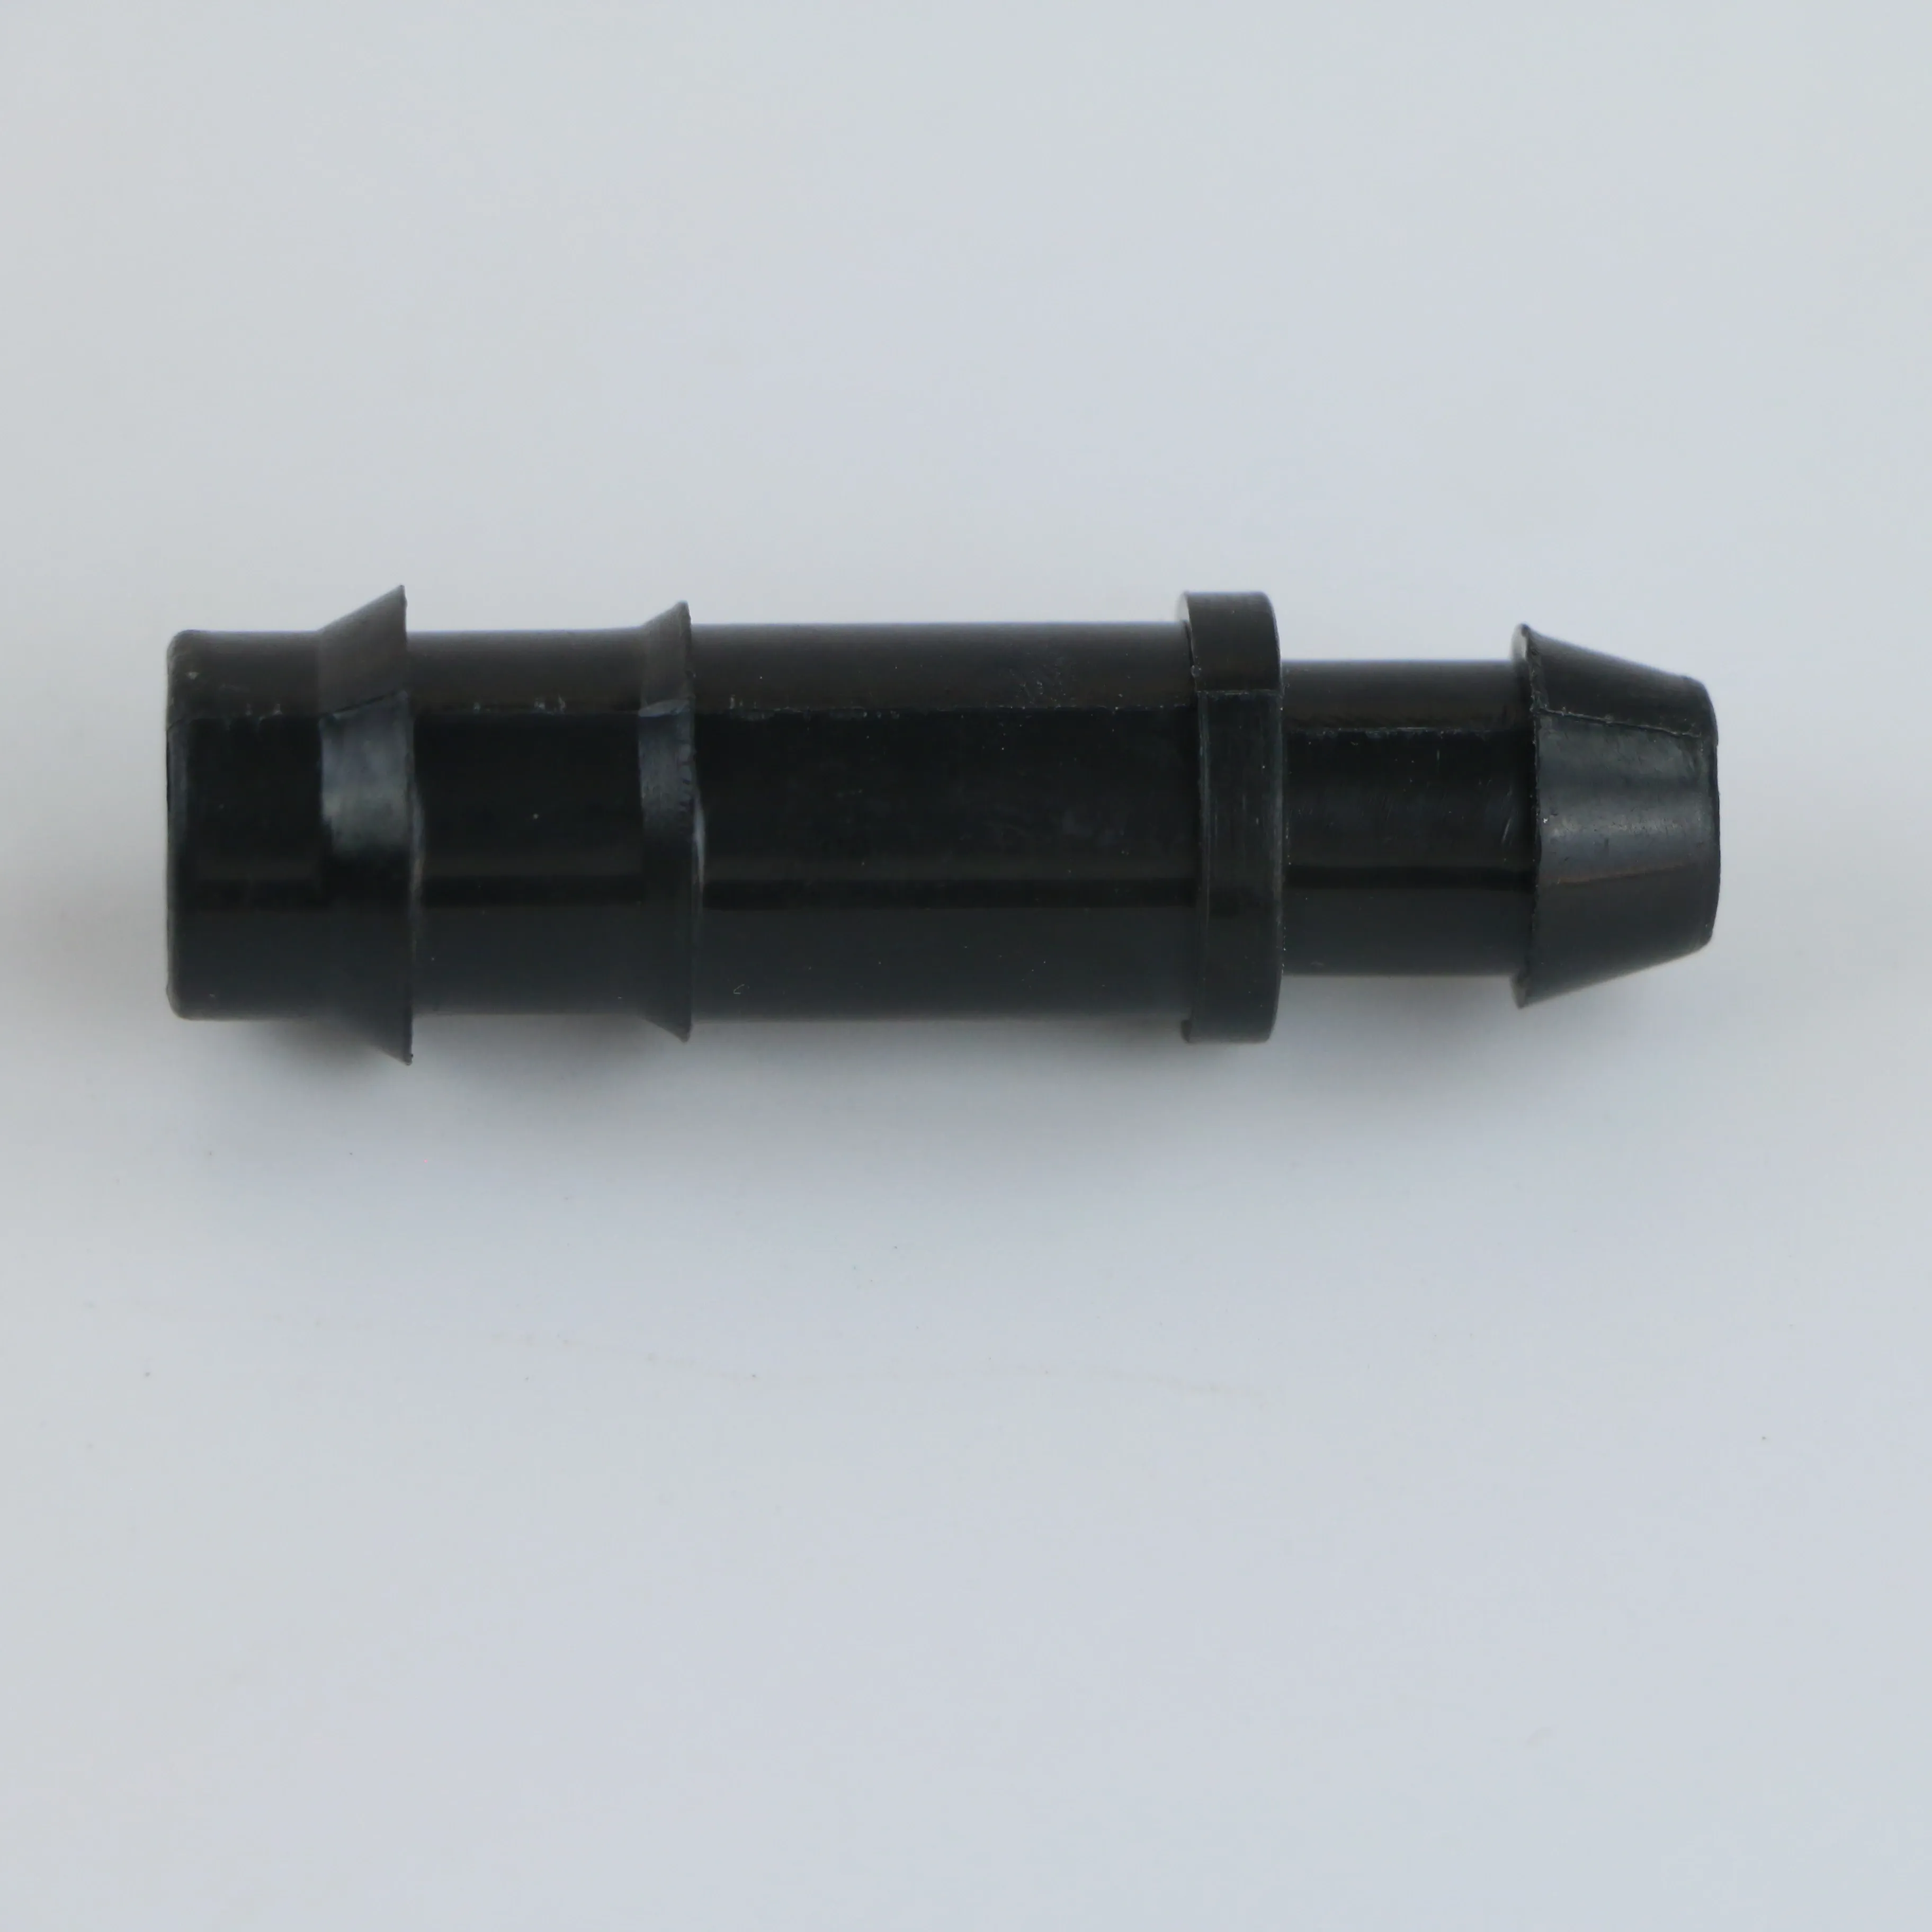
IRRINEX irrigation connection fitting. Diameter: 16mm; Size: 16mm. A connection fitting joins or terminates selected irrigation components. Choose the named fitting form and match both sides of the connection.
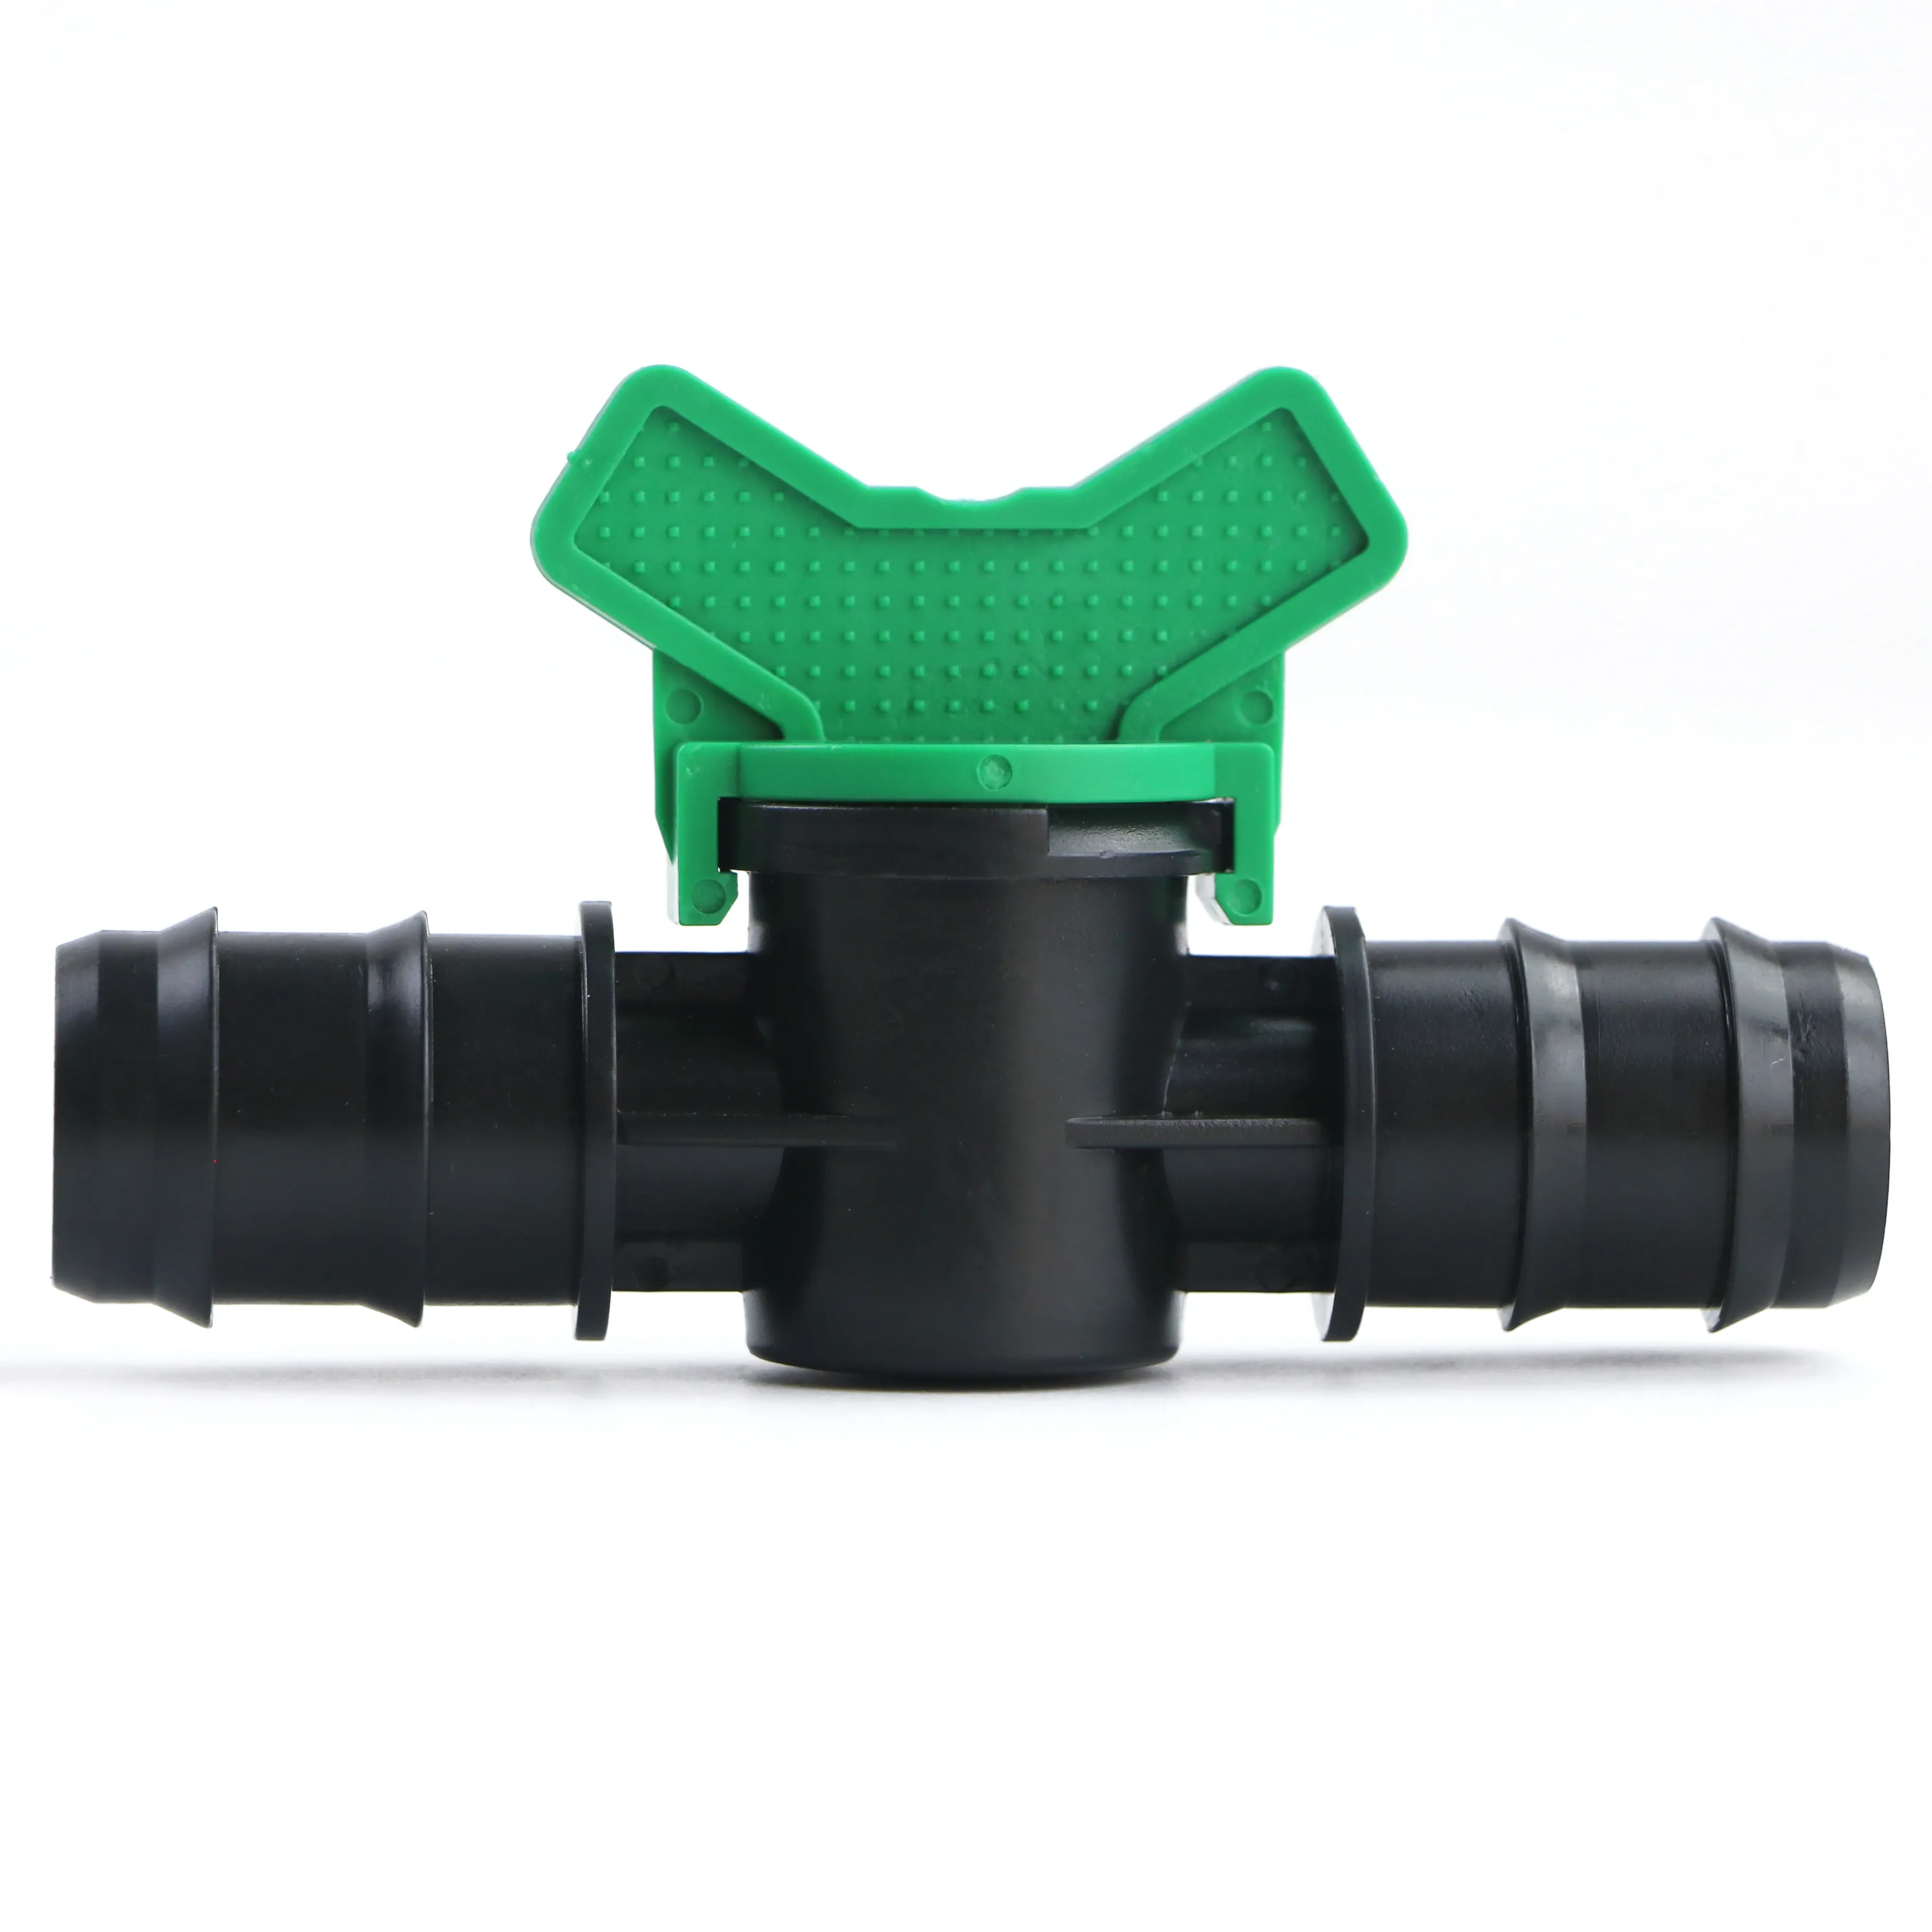
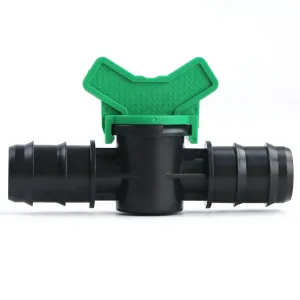
IRRINEX irrigation valve. Diameter: 16mm; Size: 16-25mm; Connection: push in. An irrigation valve forms part of the system's flow-control arrangement. The named valve form and its actual connections should be checked before choosing a configuration.

IRRINEX irrigation connection fitting. Diameter: 2 in; Size: 20-400mm; Working Pressure: 10bar. A connection fitting joins or terminates selected irrigation components. Choose the named fitting form and match both sides of the connection.