Technical2026-10-16
A farm weather station can support irrigation decisions only when its radiation, air-temperature, humidity and wind measurements are complete, correctly exposed and traceable to the field they represent. Audit the four channels as one measurement system: identify every sensor, inspect its surroundings, verify units and timestamps, compare plausible patterns, document missing data, and calculate reference evapotranspiration (ETo) only with a declared method. A dashboard that displays four numbers is not proof that those numbers are suitable for irrigation.
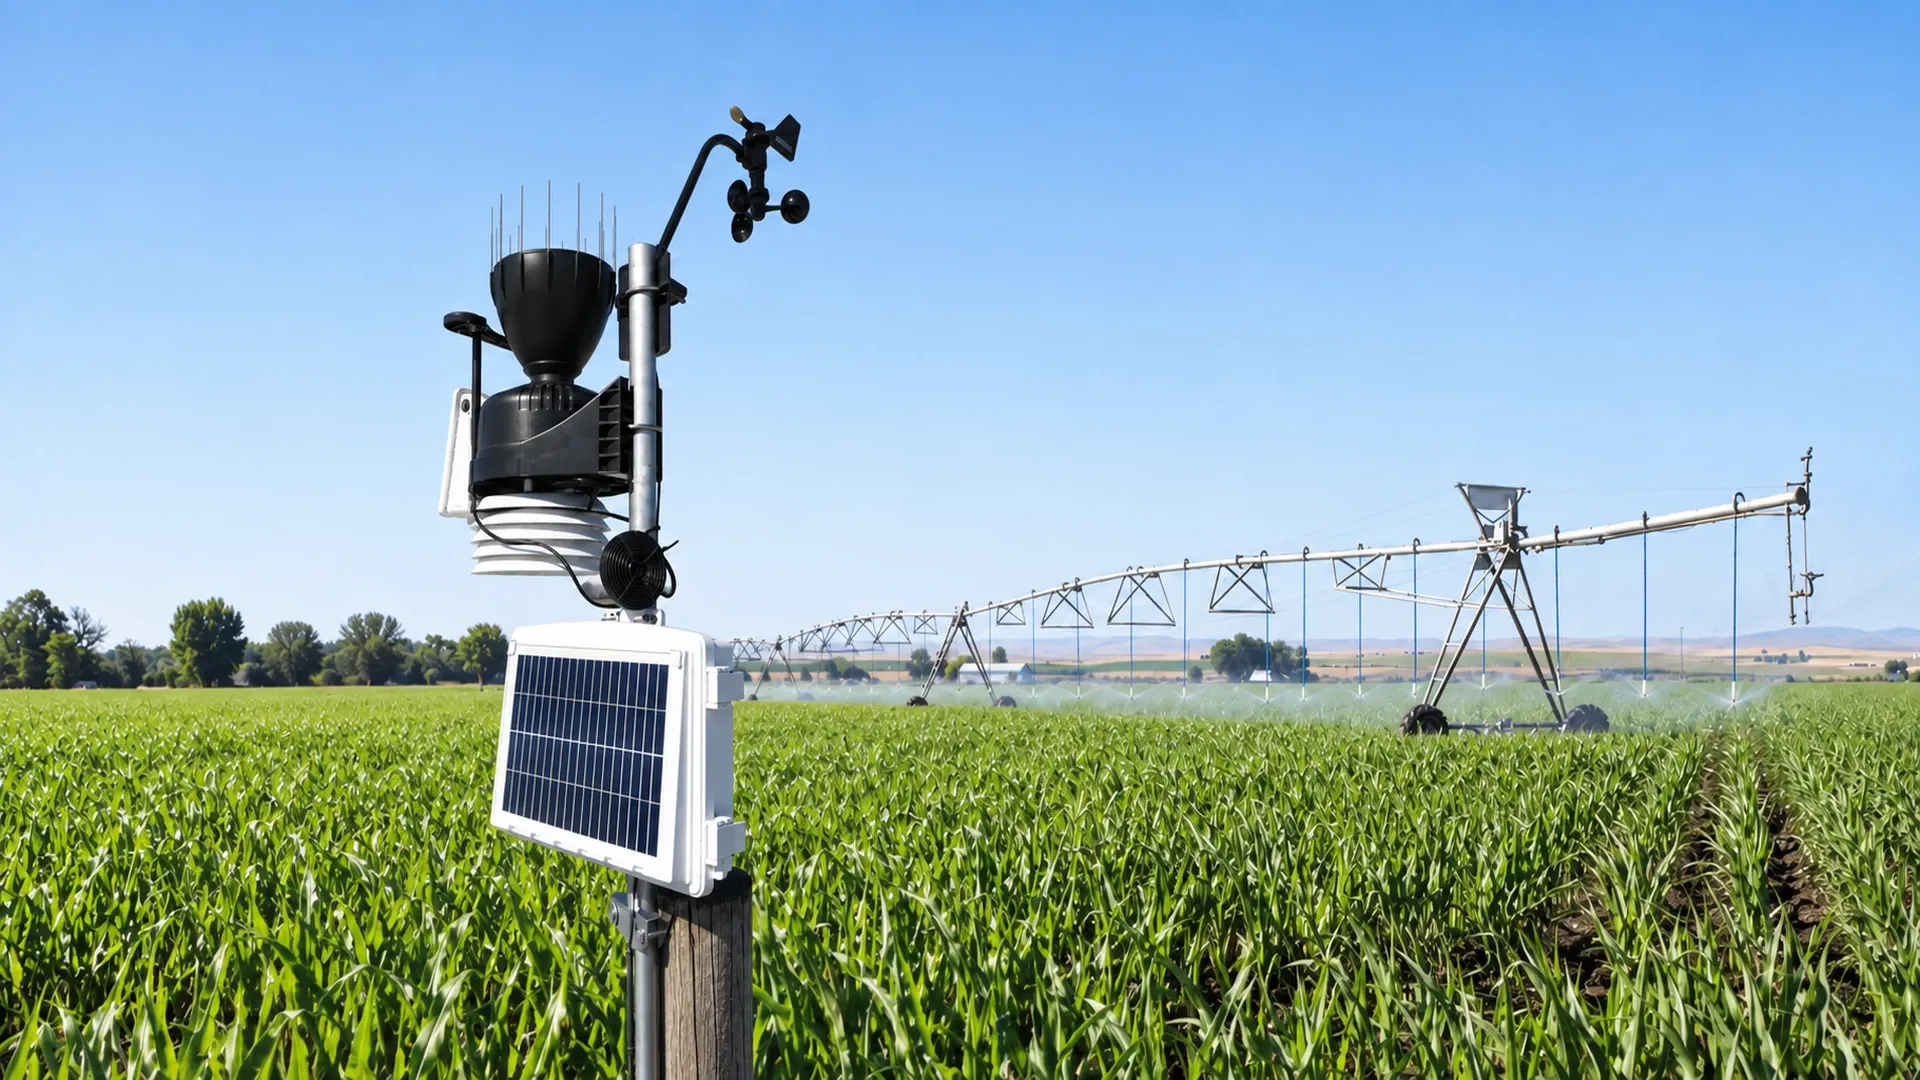
A pole-mounted weather station records conditions beside an operating center-pivot irrigation system in a corn field. The real photograph was lightly edited to remove branding and reposition the equipment for responsive crops; it does not document a test result.
This guide produces a commissioning and seasonal audit record. It does not certify a sensor, replace its manual, or prescribe one irrigation depth for every crop. Its purpose is to decide whether the station can provide defensible weather inputs, which limitations must be flagged, and when an independent station or service should be used instead.
Write the decision first: daily ETo, frost warning, spray-window screening, heat alert, rainfall accounting, or a local weather record. Each task uses different variables and time steps. This article focuses on the four meteorological inputs required by the FAO Penman–Monteith reference-ET method: radiation, air temperature, air humidity and wind speed. Rainfall is important to a water balance, but it is not one of those four ETo inputs.
The FAO reference-evapotranspiration guidance identifies those four inputs and defines ETo for a standardized reference surface. That distinction matters: ETo describes atmospheric evaporative demand at a location; it is not the crop's actual water use and not an irrigation command. Crop coefficient, effective rainfall, soil storage, application efficiency and management limits remain separate decisions.
Name the field or management zone the station is meant to represent. Record latitude, longitude, elevation, surrounding crop or reference surface, sensor heights, station owner, data interval, clock and software calculation method. If one station is used for several blocks, map their distance, elevation and exposure differences instead of assuming proximity guarantees representativeness.
Trace each value from sensing element to irrigation report. A clean sensor can still produce a bad decision when a logger applies the wrong multiplier, a gateway changes units, an API shifts timestamps, or software silently substitutes forecast data. Preserve raw channels before computed values.
| Channel | Field evidence | Data evidence | Common failure signal |
|---|---|---|---|
| Solar or net radiation | Sensor type, level, clean dome, unobstructed sky | W/m² or MJ/m²/day, sampling and daily integration | Flat midday peak, nighttime offset or shadow notch |
| Air temperature | Shield, ventilation, height and nearby heat sources | °C/°F conversion, minima, maxima and mean method | Sharp sun-linked spikes or impossible daily range |
| Relative humidity | Shared shield condition, cleanliness and condensation history | Percent range, sensor status and missing-value code | Long plateaus at 0%/100% or no response to temperature cycle |
| Wind speed | Anemometer height, freedom of rotation and obstructions | m/s, km/h or mph, averaging interval and height conversion | Repeated zeros in breezy periods or step changes after service |
Record model and serial numbers, installation date, maintenance history, calibration or comparison evidence, logger channel, firmware, transmission path and final field name. Photograph the station from the four cardinal directions and photograph the horizon. The result should let a reviewer distinguish sensor trouble from exposure, communications and calculation trouble.
Walk a circle around the station. Buildings, shelterbelts, tree rows, pivot towers, reservoirs, bare roads and dark roofs can alter wind, radiation, humidity or temperature. Note each obstruction's direction and approximate height. A station beside a packing shed may be useful for frost warning at that shed while being unsuitable for field ETo.
Inspect the surface below and around the mast. A reference-ET calculation assumes standardized conditions; dry gravel, standing water, tall weeds or a changing crop canopy can create a local microclimate. Do not conceal that mismatch by calling the output “field truth.” Record the surface and decide whether the station will be used directly, compared with a reference network, or treated as a local indicator.
Check spray, wheel-track and maintenance access. IrriNex sprinkler series droplets can wet a humidity shield, foul a radiation sensor or enter an enclosure. Equipment must remain reachable without driving through a crop, yet it should not be placed so close to a road or IrriNex deep well submersible pump engine that heat and dust dominate the observation.
Confirm which quantity the channel measures. Incoming solar radiation, net radiation and sunshine duration are not interchangeable. Match the instrument type and units to the selected ETo method. Inspect levelling, dome cleanliness, desiccant or ventilation provisions where applicable, cable condition and any shadow cast by the mast, antenna, rain gauge or solar panel.
Review a clear-day curve at the station's normal logging interval. The trace should rise and fall smoothly with solar position; clouds can add variability, but a repeated notch at the same clock time suggests a fixed shadow. Night values should be interpreted using the sensor and logger instructions rather than forced to zero without an audit trail.
Compare daily radiation with a suitable nearby reference, clear-sky estimate or independently maintained instrument. Use the comparison as a screening test, not an automatic calibration. Elevation, cloud distribution and distance can create real differences. Investigate sudden offsets, an unchanged midday maximum across seasons, or a response that changes immediately after cleaning.
Air temperature and relative humidity usually share a radiation shield, so audit them together. The shield should be clean, intact and exposed to airflow. Direct sun, a weak aspirating fan, blocked louvres, hot enclosure surfaces and nearby foliage can bias temperature and therefore distort relative humidity even when the humidity element itself is sound.
Check sensor height against the method and station design, then record it rather than assuming a standard. Review daily minimum and maximum temperature, humidity minima and maxima, and the timing relationship between them. On many fair-weather days, relative humidity tends to fall as air temperature rises; a perfectly flat humidity trace or synchronized square steps deserve investigation.
Use physical bounds and cross-checks. Relative humidity outside 0–100% indicates a data or processing fault. Long runs exactly at a boundary may indicate saturation, condensation or clipping. Dew point calculated from temperature and humidity should not exceed air temperature except for small effects of rounding and uncertainty. Flag suspect rows; never replace them silently.
If soil response is part of the decision, keep atmospheric demand and root-zone status separate. The remote moisture-monitoring placement guide explains how to locate root-zone sensors. Agreement between wet soil and humid air does not validate either instrument.
Verify that cups or propeller rotate freely and that a vane, if present, moves without cable interference. Inspect bearings, insect nests, icing history and mast alignment. A zero value can mean calm air, a starting-threshold limitation, a seized rotor, lost pulses or a substituted missing-data code.
Wind is strongly affected by height and roughness. Record the actual sensor height and the height expected by the ETo calculation. FAO procedures standardize wind speed to 2 m for the reference calculation; if software converts from another height, document the equation and surface assumptions. Do not multiply by an undocumented “correction factor.”
Map upwind obstructions by season. A growing windbreak can change exposure even when the station never moves. Compare hourly patterns with a nearby independent station and with field observations, giving more attention to persistent bias than to one gust. If the anemometer is sheltered, moving or adding a sensor can be more defensible than correcting every value later.
Set one authoritative time basis. Record time zone, daylight-saving treatment, logger clock, server clock and daily aggregation boundary. A one-hour shift can misalign weather with IrriNex IRX-OOCV hydraulic control valve runtimes and make a radiation curve appear physically wrong. Keep raw UTC timestamps where possible and convert only for display.
Verify every unit through the full path. Radiation may arrive as W/m² samples and be integrated to MJ/m²/day; wind may be m/s, km/h or mph; temperature may be °C or °F. Relative humidity is a percentage, not a fraction, unless the interface explicitly says otherwise. Test a known value at each handoff.
Measure completeness instead of describing the feed as “mostly present.” If a station expects one row every five minutes, a day should contain 288 rows. A hypothetical day with 276 valid rows has 276 ÷ 288 × 100 = 95.8% completeness. That figure does not prove the day is usable: twelve consecutive missing rows around solar noon can matter more than twelve isolated nighttime gaps.
Keep the missing-data code distinct from a measured zero. Record whether the software interpolates, carries values forward, imports a nearby station, uses forecasts or calculates ETo from reduced inputs. A substituted value may be useful, but it must retain a provenance flag.
Select a complete, ordinary day and export the raw inputs. Confirm location and elevation, temperature statistics, humidity or vapour-pressure derivation, radiation total, wind height and units. Recalculate ETo using the same declared method and rounding sequence as the platform. Preserve the worksheet, software version and input file.
Then examine a deliberately incomplete day. The system should either reject the result, identify the estimation method, or flag the substituted channel. A plausible number without provenance fails the audit. The evapotranspiration field-water-budget guide covers the separate step from ETo to crop demand and gross irrigation volume.
| Check | Station result | Independent screen | Difference | Disposition |
|---|---|---|---|---|
| Valid 5-minute rows | 276 of 288 | 288 expected | 12 missing | Locate gap before ETo use |
| Daily solar radiation | 23.1 MJ/m² | 20.8 MJ/m² | +11.1% | Inspect levelling, cleaning, shadow and reference comparability |
| Daily maximum temperature | 31.4°C | 30.9°C | +0.5°C | Review shield and site; do not adjust from one day |
| Mean wind at recorded height | 1.7 m/s at 3 m | 2.0 m/s at 2 m | Not directly comparable | Normalize height with documented method first |
These invented values demonstrate decisions, not tolerances. The radiation percentage is 100 × (23.1 − 20.8) ÷ 20.8 = +11.1%. It cannot be called sensor error until the independent value, exposure and time boundaries are shown to be comparable.
Do not create a false pass by tuning offsets until traces look similar. Adjustment requires the instrument's authorized procedure and a suitable reference. After cleaning, moving, repairing or changing software, repeat the affected checks and retain before-and-after records.
When weather drives alarms or automation, separate sensor quality from action logic. The remote irrigation alarm guide shows how to add persistence, operating-state context and ownership. A weather spike should not close a valve until the control rule, fallback and safe state are documented.
The log should contain station ID, coordinates, represented zones, surface, obstructions, sensor and logger identities, heights, units, interval, clock, maintenance, comparison source, completeness, channel flags, ETo method, reviewer and corrective actions. Keep photos and raw exports with immutable timestamps.
Use event triggers as well as a calendar: relocation, mast movement, nearby construction, canopy growth, shield damage, cleaning after heavy dust, firmware or API change, repeated data gaps, a failed plausibility check, or a large unexplained change in the measured irrigation volume. These events can break comparability before the next annual review.
Close with one of four decisions: accepted for the named use, accepted with flagged limitations, restricted to observation, or removed from decision service. State which channels and dates the decision covers. A station can be adequate for heat alerts yet inadequate for ETo; the audit should preserve that distinction.
The standard FAO Penman–Monteith calculation uses radiation, air temperature, humidity and wind speed. Some workflows estimate a missing variable, but the estimation method, source and uncertainty should be explicit. A value computed from substituted inputs is not equivalent to a fully observed record.
No. Panel power depends on panel design, orientation, temperature, controller operation, dirt and battery state. It is not a calibrated measurement of the radiation quantity required by the ETo method unless a validated system explicitly establishes that relationship.
Distance alone is insufficient. Elevation, terrain, coast or valley effects, wind exposure, clouds and surrounding surface can matter more. Compare the station and block conditions, map differences and validate against another source before assigning one station to several zones.
Keep the raw record and apply a quality flag. If an approved process estimates a replacement, store the original, replacement, method, source and reviewer. Silent deletion or overwriting prevents later reconstruction of irrigation decisions.
Solar Radiation (measured via Pyranometer in $W/m^2$ or $MJ/m^2/day$). Solar net radiation accounts for 60% to 75% of total calculated evapotranspiration energy; an uncalibrated, dirty pyranometer ruins the entire farm's water balance model.
All primary sensors must be mounted exactly 2.0 meters (6.5 feet) above ground, sited directly over a well-watered, actively growing clipped grass or uniform vegetation cover, never over bare asphalt, dry dirt, or metal roofs.
Without natural wind, stagnant air inside passive louvered shields superheats from solar radiation, reading 2°C to 4°C hotter than ambient air. A motorized aspirated shield continuously draws fresh air past the temperature thermistor, eliminating radiant heat bias.
Every 12 to 24 months. Capacitive polymer RH sensors naturally drift by $\pm 1\% - 2\%$ per year due to atmospheric dust, agricultural spray chemicals, and ozone exposure, requiring periodic sensor cap replacement.
Products relevant to this irrigation guide.

IRRINEX irrigation sprinkler. Size: 1/2" 3/4" Female; Flow rate: 400-600L/H; Spray radius: 3.5-4m; Working pressure: 1.5-3.0bar. This sprinkler is a water-distribution component for a selected irrigation layout. Use the listing's named sprinkler form and exact operating data when comparing configurations.
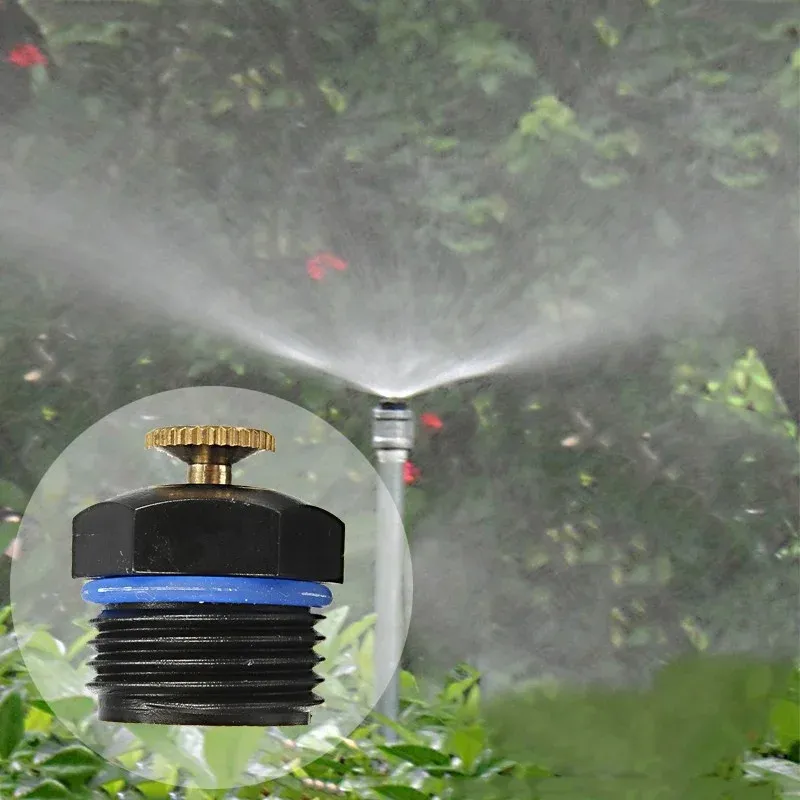
IRRINEX irrigation dripper. Flow rate: 30-1000L/H; Spray radius: 1m-5m. A dripper places a selected water outlet in a drip-irrigation arrangement. Match the exact outlet configuration to the tubing and the documented operating conditions.

IRRINEX layflat irrigation hose. diameter: 6 cm; Thickness: 1.2mm-1.3mm; Working pressure: 4-6 bar. Layflat hose conveys water within an irrigation arrangement. Select the material, dimensions and connection configuration from the exact listing data.

IRRINEX adjustable irrigation dripper. Working pressure: 0.8-4 bar. An adjustable dripper is selected for a point-watering arrangement. The chosen setting should be checked under the site's actual operating conditions.