Irrigation Well Drawdown: Adjust Pumping Plans to the Dynamic Water Level
Irrigation well drawdown should be managed from the dynamic water level measured while the irrigation pump is delivering a known flow. Record a rested static water level, start the pump at a defined zone demand, measure the pumping water level until it approaches a stable trend, and calculate drawdown as pumping depth minus static depth. Pair every level with flow and time. Those paired observations show whether the farm can keep the present duty, reduce flow, rotate smaller zones, add recovery time, or stop before the pump intake loses safe submergence.
A pump curve cannot establish sustainable well yield by itself. The curve describes the pump; the drawdown and recovery response describe the combined aquifer, well screen, casing, well development and pumping rate. This guide turns those separate measurements into a repeatable operating plan without treating one test or one threshold as universal.
What do static level, dynamic level and drawdown mean?
Use one surveyed or permanently marked measuring point at the wellhead. Depth readings increase downward from that point. The static water level is the depth to water after the well has rested long enough for the intended baseline. The dynamic water level, also called pumping water level, is the depth to water at a stated elapsed time while the pump is running at a measured discharge. Drawdown is the difference between those two depths.
As dynamic water levels fall during extended dry-season pumping cycles, operators monitor total head on high-head centrifugal surface pumps to avoid operating near the steep cut-off boundary of the pump curve.
Drawdown = pumping water-level depth − static water-level depth
Specific capacity is measured flow divided by drawdown, such as US gallons per minute per foot or cubic metres per hour per metre. It is a field indicator tied to a particular test rate and elapsed time. It is not the same as pump efficiency and it can change with season, pumping duration, nearby wells, screen condition and measurement quality.
| Term | How it is recorded | Operating use |
|---|---|---|
| Measuring point | Permanent mark and elevation at the access tube | Keeps every depth comparable |
| Static level | Depth after a documented rest period | Tracks seasonal aquifer change |
| Dynamic level | Depth at a stated flow and elapsed time | Sets lift, submergence and operating limits |
| Drawdown | Dynamic depth minus static depth | Shows the response to pumping |
| Specific capacity | Measured flow divided by drawdown | Trends well performance at comparable duty |
| Recovery | Water level versus time after shutdown | Supports rest intervals and fault diagnosis |
Define the measurement boundary before testing
Start with the well completion record, pump setting depth, screened interval, motor and column details, previous pump tests, permits and any known seasonal limits. Mark the exact point from which the tape or sensor reports depth. A reading referenced to the ground on one visit and the top of a casing on another can create a false trend.
Choose a flow measurement that represents the well discharge, not an estimated zone total. Verify the meter unit and multiplier using the irrigation flow-meter pulse method. Record discharge pressure, filter differential pressure, pump speed, active valves, nearby-well activity and whether water is returning near the well. A changing field configuration creates a changing test.
Write down the minimum permissible dynamic level before starting. The limit may depend on pump intake elevation, required motor cooling, net positive suction conditions, screen position, local regulation and the contractor’s recommendation. Do not invent a generic distance above the intake. Treat the approved site limit as an interlock value and keep an additional response margin above it.
How to measure irrigation well drawdown in the field
1. Establish a rested static water level
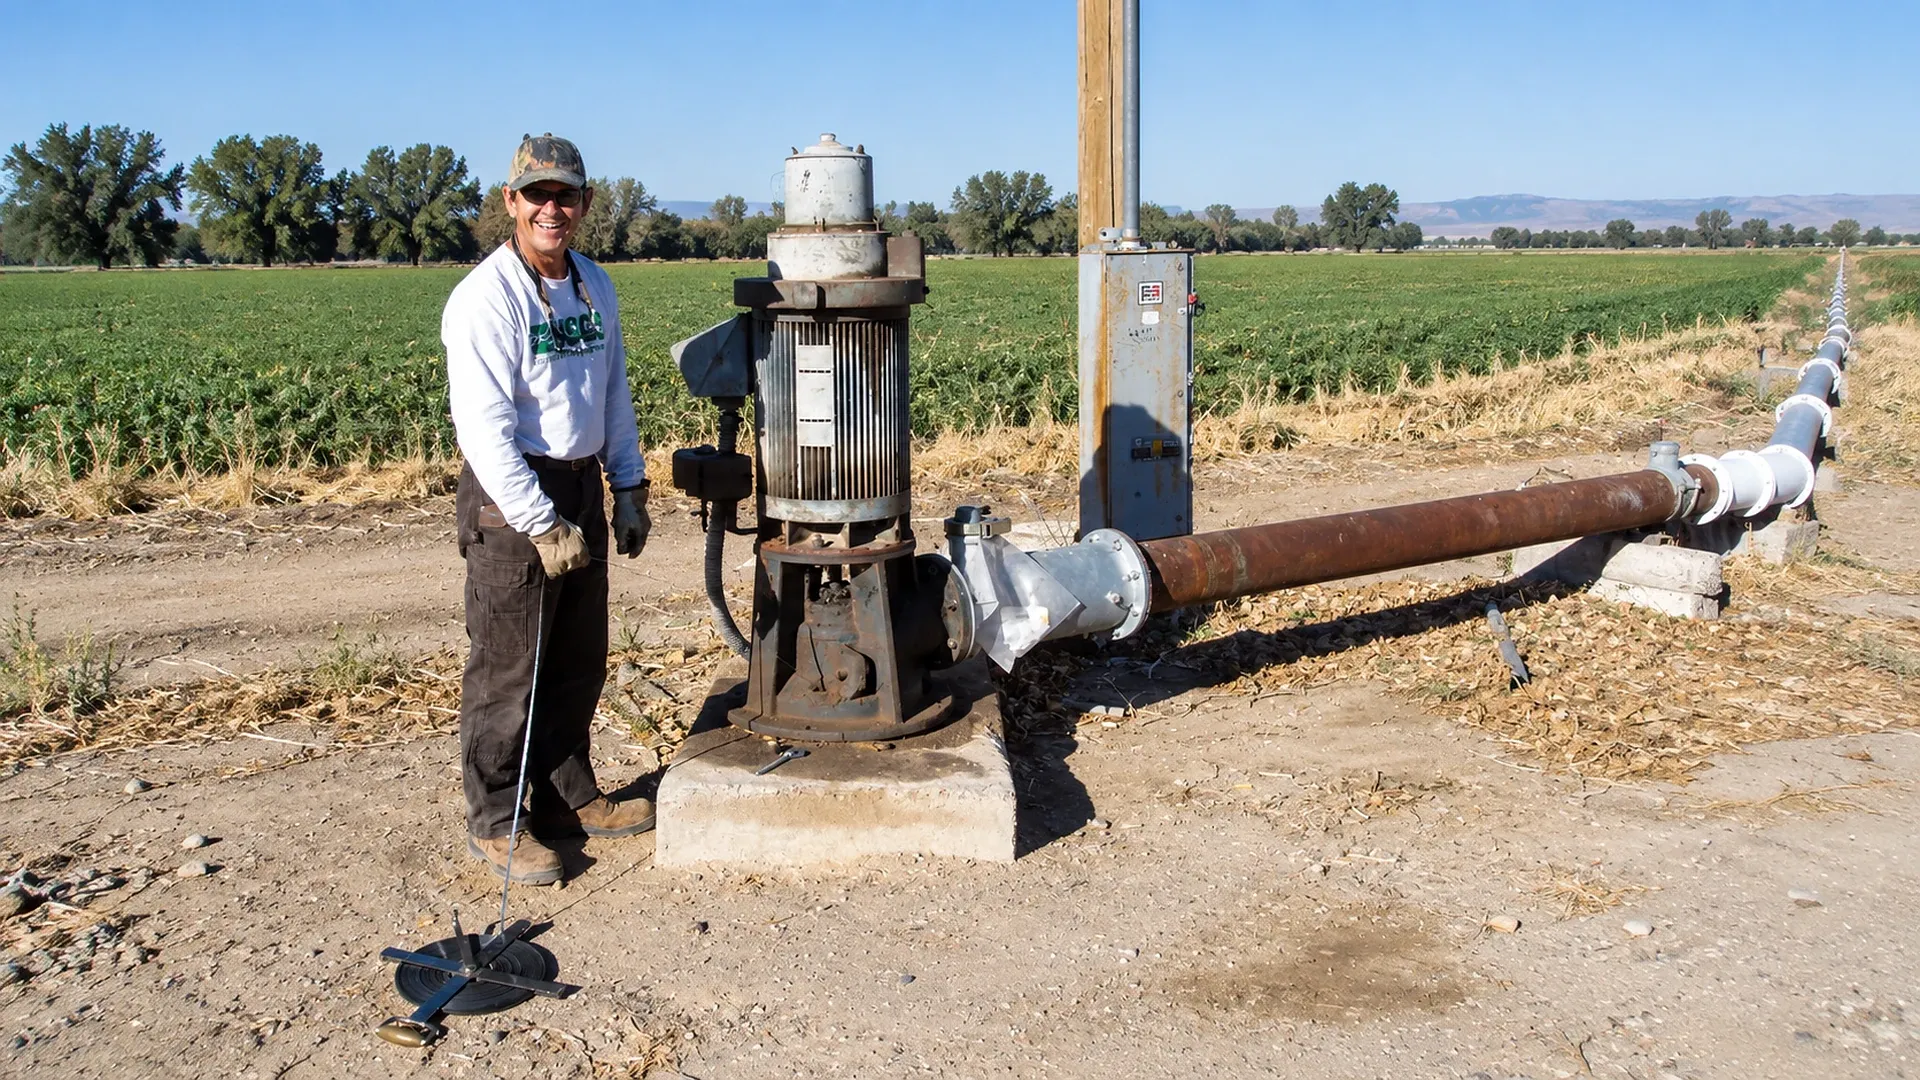
Stop the well and document how long it has rested. Confirm that connected or nearby wells are not distorting the reading. Test an electric sounding probe in water before use, lower it through a dedicated access or sounding tube, and read the marked cable at the permanent measuring point. Repeat the contact slowly. Two close readings are more defensible than one hurried value.
Connecting deep well discharges to surface distribution networks requires durable durable polyethylene delivery mains rated for maximum shutoff head pressures.
2. Start one repeatable irrigation duty
Open the chosen zone path, start the pump and stabilize the intended speed or control mode. Record the initial flow and discharge pressure. If the test uses variable speed, retain actual frequency or rpm. The irrigation pump-curve guide explains why changing zones also changes the operating point; that is why a level without its matching duty cannot be compared fairly.
3. Log dynamic level, flow and pressure on the same clock
Measure frequently during the rapid early decline, then lengthen the interval as the trend slows. A practical log might use 1, 2, 5, 10, 15 and 30 minutes, then every 30 or 60 minutes, but well response and the professional test plan control the interval. Do not call the last value “stable” merely because the test ended. State the slope, for example 0.2 ft/h during the final hour.
4. Hold the test rate or segment every change
If flow, speed, zone state, backwash operation or outlet pressure changes materially, mark the event. End that constant-rate segment and begin another. Specific capacity calculated across mixed rates has no clear meaning. If the level approaches the approved limit, flow deteriorates, sand appears, the motor load changes abnormally or air enters the discharge, stop according to the response plan.
| Time | Pump state | Flow | Pressure | Depth to water | Observation |
|---|---|---|---|---|---|
| Before start | Off; rest time stated | 0 | 0 | Static reading | Nearby wells and datum checked |
| 1–5 min | Target speed | Metered | Gauge reading | Frequent readings | Rapid-change period |
| 10–30 min | Unchanged | Metered | Gauge reading | Timed readings | Note air, sand or vibration |
| Each later interval | Unchanged | Metered | Gauge reading | Timed reading | Calculate level slope |
| Any event | Describe change | Before/after | Before/after | At event | Start a new test segment |
| Shutdown | Off | 0 | Residual only | Final pumping level | Start recovery clock |
Put the dynamic water level into total dynamic head
For a groundwater pump, the vertical lift used in an operating calculation begins at the pumping water surface, not the rested static surface. Express all components as head in the same unit and use consistent datums. A simplified operating budget is:
TDH = pumping lift + required outlet pressure head + elevation rise after the wellhead + pipe, valve and filter losses
If the pump discharges to a point below the measuring datum or if pressure is measured somewhere else, adjust the elevations explicitly. Convert gauge pressure for water with approximately 2.31 ft of head per psi, or 10.2 m per bar. Include losses at the measured flow. The irrigation pump sizing worksheet provides the broader flow-and-head framework.
Design checks should consider the maximum credible seasonal pumping depth, while an energy or operating assessment should use the level measured during that run. Mixing a spring static level with late-summer pressure and flow understates the actual duty.
Worked example: 700 gpm well with 46 ft of drawdown
A farm uses a permanent wellhead datum. After the documented rest, static water is 82 ft below the datum, equal to 25.0 m. The irrigation pump supplies 700 US gpm, or about 159 m³/h. After four hours at the same duty, the dynamic level is 128 ft, or 39.0 m, and the final-hour trend is small enough to report as an observed four-hour condition.
| Quantity | US customary | Metric |
|---|---|---|
| Static depth | 82 ft | 25.0 m |
| Four-hour pumping depth | 128 ft | 39.0 m |
| Drawdown | 128 − 82 = 46 ft | 39.0 − 25.0 = 14.0 m |
| Measured discharge | 700 gpm | 159 m³/h |
| Specific capacity | 700 ÷ 46 = 15.2 gpm/ft | 159 ÷ 14.0 = 11.4 m³/h/m |
| Required outlet pressure | 50 psi = 115.5 ft | 5.0 bar ≈ 51.0 m |
| Field elevation rise | 18 ft | 5.5 m |
| Pipe, valve and filter losses | 27 ft | 8.2 m |
| Operating TDH | 128 + 115.5 + 18 + 27 = 288.5 ft | 39.0 + 51.0 + 5.5 + 8.2 = 103.7 m |
The English and metric pressure conversions are rounded independently, so their TDH totals do not convert exactly. The operating lesson is unchanged: using the 82 ft static level would omit 46 ft, or 14.0 m, of pumping lift. That error would move the assumed system curve, distort power expectations and may select an operating point the well cannot hold.
The calculated 15.2 gpm/ft is not a permit, a guaranteed yield or a pump rating. It describes this well at 700 gpm after four hours under the recorded conditions. A different rate needs its own constant-rate or step test and professional interpretation.
Run and interpret a recovery test
At shutdown, keep the same datum and start a recovery clock immediately. Record depth at short intervals first, then less often as the level returns toward the pre-test condition. Example readings could be 128 ft at shutdown, 112 ft at 5 minutes, 101 ft at 15 minutes, 93 ft at 30 minutes, 87 ft at 60 minutes, 84 ft at 120 minutes and 82.5 ft at 240 minutes. Preserve the whole curve rather than reporting only “recovered.”
For that example, 45.5 ft of the 46 ft drawdown has recovered after four hours, or about 98.9%. That does not prove the same recovery during a dry season or during simultaneous operation of neighboring wells. Compare recovery curves at similar starting conditions. Slower recovery, greater drawdown at the same flow, or a continuing decline late in the test is a reason to investigate the well and aquifer rather than simply increasing pump speed.
Use recovery evidence to test a rotation plan. If the well needs two hours to recover within the farm’s approved margin, divide demand into smaller blocks, alternate with another source, or fill storage during lower-demand periods. The required pressure and crop delivery still must be verified; rest time alone does not fix an oversized zone.
Convert drawdown data into pumping and zone decisions
Build an operating envelope rather than a single maximum. Each row should pair flow, pump speed, zone combination, dynamic level after a stated duration, outlet pressure and the final level slope. Within that envelope, the controller can choose a smaller zone or lower speed before reaching the response margin. The pump-station sequencing guide helps coordinate source capacity with variable demand.
When drawdown increases but static level is similar, inspect screen restriction, well development, sediment, measurement error and nearby pumping. When static and pumping levels both deepen by a similar amount, seasonal or longer-term aquifer change may dominate. When level is steady but flow falls, examine pump wear, speed, voltage, valves, filtration and the flow meter. These patterns guide diagnosis; they do not replace a pump test or well inspection.
- Keep the present duty only while flow, pressure, level and trend remain inside the verified envelope.
- Reduce simultaneous zone flow when dynamic level approaches the response margin.
- Use lower speed only after confirming the reduced-speed pump curve still meets field pressure.
- Rotate zones or sources to provide measured recovery time.
- Use storage to separate a limited well production rate from a higher short-term irrigation demand.
- Retest after well cleaning, pump changes or significant control changes.
Set site-specific triggers and fault responses
Thresholds must come from the pump setting, intake submergence, motor cooling requirement, screened interval, water quality, professional test and repeatability of the instruments. The values below illustrate the logic for the worked example; they are not general limits. Suppose a qualified well professional confirms a 150 ft shutdown limit and the healthy 700 gpm baseline is 128 ft.
| Verified condition | Example trigger | Automatic or operator response | Evidence before reset |
|---|---|---|---|
| Advisory deviation | Deeper than 134 ft for 15 min at comparable 700 gpm duty | Check flow, datum, nearby wells and recent events | Valid sensor and manual confirmation |
| Capacity warning | Specific capacity below 12 gpm/ft on two comparable tests | Schedule professional evaluation; restrict peak demand | Constant-rate records and meter checks |
| Response margin | Deeper than 142 ft or still declining faster than approved slope | Reduce speed or move to a smaller verified zone | Pressure and delivery remain adequate |
| Protective stop | 150 ft approved limit, loss of flow, air, sand or abnormal vibration | Stop and lock out automatic restart as configured | Cause found and authorized reset |
| Sensor disagreement | Transducer and manual reading differ beyond tolerance | Use safe fallback; flag data invalid | Datum, venting, scaling and calibration checked |
| Slow recovery | Recovery outside the seasonal baseline band | Extend rest; reduce planned daily withdrawal | Repeat curve and professional review if persistent |
Apply persistence and recovery hysteresis so a noisy sample does not chatter the pump. Log the raw value, validity state, trigger, controller action and manual response. The irrigation alarm design guide shows how to make those states actionable.
Maintain wet-season and dry-season baselines
At minimum, create comparable records before peak irrigation, during peak demand and near the end of the dry period. Use the same datum, instruments, flow band, test duration and zone path. Record antecedent rainfall, recent runtime, neighboring pumping and any recharge event. A static reading after an unspecified rest cannot be compared with one taken after several idle days.
Trend static depth, dynamic depth, drawdown, specific capacity, late-test slope and recovery time separately. This separation matters: a deeper static level signals a different issue from greater drawdown at the same static level. Store raw readings beside the derived indicators so a future reviewer can recalculate them.
Do not overwrite the baseline after an abnormal season. Preserve year and season labels, and define which envelope the controller is using. If water allocation, permit conditions or crop risk changes, review the pumping plan without rewriting the physical evidence.
Measure safely around the wellhead
A water-level line can contact rotating shafts, bowls or energized equipment. Use a dedicated, properly installed sounding tube. Do not drill or modify a pump base while equipment is energized; have a qualified well or irrigation professional provide safe access. Keep loose clothing and hands away from couplings. If a probe snags or vibrates strongly, stop lowering it and follow the site procedure rather than pulling it into moving equipment.
Test the sounding meter before each run, clean and dry the cable during retrieval, and compare electronic transducers with periodic manual readings. Record transducer range, units, offset, datum, vent condition, sampling interval and calibration check. Protect cables from surge, moisture and physical damage. A smooth dashboard trace can still be wrong if the datum or scaling is wrong.
Separate wellhead safety from electrical testing. Opening panels, measuring motor current or changing VFD parameters requires authorized personnel and suitable procedures. Water-level data support a decision; they do not justify bypassing pump protection.
When should a well or groundwater professional be called?
Call a licensed well contractor, hydrogeologist or applicable water authority when a sustained-rate test is required, the approved dynamic limit is unknown, the level approaches the pump intake or screen, specific capacity declines repeatedly, recovery changes materially, sand or air appears, the casing or access tube is unsafe, or nearby pumping may be interacting with the well. A professional can design step-drawdown and constant-rate tests, verify pump setting, inspect the screen and interpret aquifer response.
The Oklahoma State University Extension guide on measuring groundwater depth in irrigation wells describes static and pumping levels, electric sounding equipment and the need for safe access at the pump base. Local rules, permits and the well construction record remain controlling.
Bring the professional the original time series, flow and pressure readings, pump speed, nearby-well log, maintenance history and seasonal baseline. A screenshot of the lowest level alone cannot distinguish aquifer stress, well loss, pump trouble or a measurement fault.
Frequently Asked Questions on Irrigation Well Drawdown Dynamic Water Level
What is the definition and formula for an irrigation well's 'Specific Capacity' ($SC$)?
Specific capacity measures well productivity: the discharge rate divided by total drawdown: $$SC = \frac{Q}{s} = \frac{\text{Pumping Flow Rate (GPM or m}^3/\text{h})}{\text{Total Drawdown (feet or meters)}}$$ For example, a well producing $500\text{ GPM}$ with $25\text{ ft}$ of drawdown has an $SC = 20\text{ GPM/ft}$.
How does mid-summer aquifer drawdown directly alter the performance of a fixed-speed irrigation pump?
As the water table drops, Total Dynamic Head ($TDH$) increases by the exact number of meters of additional lift. Following the pump H-Q curve, higher head forces the pump to deliver significantly less flow ($Q$) to the field, causing under-watering.
What causes a well's Specific Capacity to decline gradually over several seasons?
A drop in $SC$ indicates well screen encrustation (calcium carbonate precipitation or iron bacteria biofilm clogging slots), or fine sand siltation in the gravel pack, increasing well-skin friction loss. Acidification or brush re-development is required.
How do you avoid 'Cone of Depression Interference' when drilling a second irrigation well on the same farm?
Space wells outside each other's radius of influence (typically a minimum of 300 to 500 meters apart in unconfined aquifers). Overlapping cones of depression accelerate local drawdown, doubling pumping energy costs.