Solar-Powered Irrigation Controllers: Size the Panel and Battery for Low Sun
Size a solar-powered irrigation controller from its daily energy demand, the usable battery reserve and the sunlight available during the limiting operating period. The panel must supply the ongoing load and replace energy withdrawn during poor weather. A system that only balances an average day may recover too slowly after several days without useful charging.
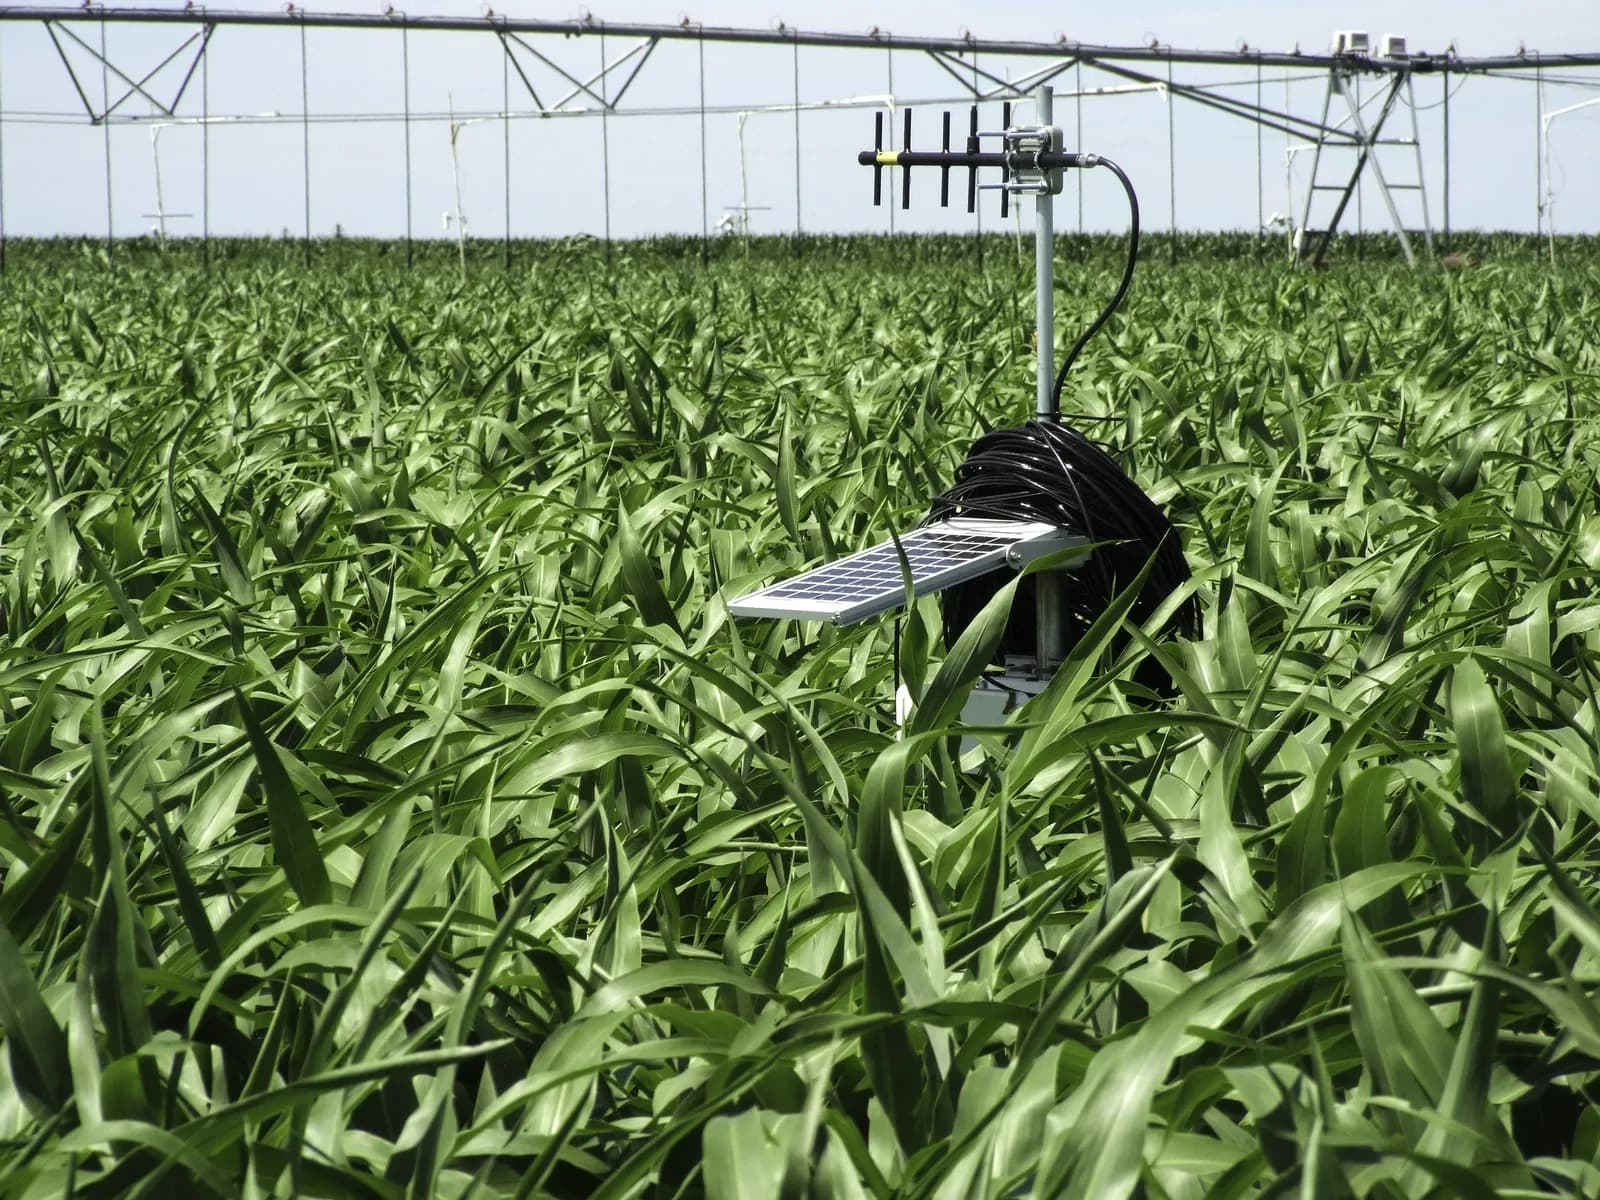
Solar-powered soil-water monitoring station in a corn field, with a center-pivot irrigation system behind it. The photograph does not establish the controller or battery capacities in this example. Photo: Nancy Davis, USDA Agricultural Research Service.
This guide covers a remote agricultural irrigation controller, its supported valve actuation, sensors and communications. Pump-motor energy is outside this example. Every load, panel size, battery factor and solar-resource value below is hypothetical; the calculations explain a review method, not the rating of an IrriNex product or a complete electrical design.
1. Draw the boundary around the equipment being powered
List the irrigation controller, communications gateway, sensors, valve actuators, charge controller and any converters that share the supply. Identify continuous loads and additional event loads. Include valve closing, manual tests, radio retries and restart behavior. A small timer with an integrated solar cell and a larger cabinet serving several devices can have very different demands.
Separate the irrigation controller from the solar charge controller in the documentation. The first manages watering functions; the second manages energy from the photovoltaic array and its interaction with the battery. A product may integrate both functions, but neither name proves that an arbitrary battery, panel or solenoid is compatible.
The irrigation controller architecture guide helps establish the valve-output arrangement. Record whether valves draw only during a state change or also while held open. Keep the water pump on a separate energy worksheet unless its full running and starting requirements are explicitly included.
Choose a common accounting boundary. Here, daily demand is expressed as energy required at the useful load boundary. All conversion and storage losses between the panel, battery and that boundary are handled in explicitly named factors. If measurements already include a loss, do not subtract it again elsewhere.
2. Build the irrigation controller's daily watt-hour budget
For a constant load, energy in Wh equals power in W multiplied by operating time in hours. Integrate varying power over the complete event when measurements are available. An actuator's brief output pulse may not capture the later recharge of internal energy storage, so use the complete supply-side event and translate it to the chosen boundary consistently.
| Load contribution | Assumed daily duty | Energy |
|---|---|---|
| Controller baseline and allocated supply electronics | 0.45 W for 24 h | 10.8 Wh |
| Separate continuously powered sensors | 0.15 W for 24 h | 3.6 Wh |
| Communication activity above baseline | 2 W additional power for 0.6 h | 1.2 Wh |
| Complete valve-command events above baseline | Combined event-energy allowance for the daily schedule | 2.4 Wh |
| Total | All listed contributions | 18.0 Wh/day |
The sensor contribution is separate from the controller baseline; the communication and valve entries are incremental. This avoids counting a full-day baseline and then counting that same baseline again inside each event. The allocated supply-electronics demand must include the actual quiescent consumption of the selected arrangement.
Repeat the budget for each meaningful operating mode. A field may need fewer valve operations outside the growing season while the gateway remains awake. Conversely, a communication fault can increase demand during a period of poor charging. For the operational context, use the guide to irrigation control with unreliable internet; a solar energy budget still needs the actual device's retry behavior.
3. Select solar-resource inputs for the limiting operating period
Peak sun hours are an energy-equivalent quantity, not the hours between sunrise and sunset. In the 1999 NREL report on stand-alone photovoltaic performance, sun-hours refer to daily sunlight in the array's plane expressed as equivalent hours at 1,000 W/m². The report also defines the design month through the minimum generation-to-load ratio, which need not coincide with the least sunny month.
For example, with a hypothetical 40 W panel and an effective delivery factor of 0.60, a period with 1.5 peak sun hours and a 6 Wh/day load has a generation-to-load ratio of 6.0. A busier period with 2 peak sun hours and an 18 Wh/day load has a ratio of about 2.67. The second period is more demanding relative to supply even though it has more sunlight.
Use solar data for the installation's location, panel orientation and relevant season. Retain the dataset, period, units and method used to translate the resource to the array plane. A horizontal irradiation value is not automatically the same as the resource on a tilted panel. Inspect actual shading from crops, equipment, buildings and terrain at the proposed mounting position.
The US Department of Energy's solar and storage explanation describes how season, clouds, shadows and surface contamination affect production, and why storage can move available energy to another time. Neither an annual average nor a storage label describes the sequence of cloudy days that the irrigation installation must tolerate.
4. Calculate usable battery energy and a separate operating reserve
Battery nameplate energy and energy deliverable to the controller are different quantities. The NREL Facility-Scale Solar Photovoltaic Guidebook, section 5.1.2 distinguishes the usable storage required for an off-grid load from potentially larger nameplate capacity. It also identifies peak power and the required period without charging as separate sizing inputs.
Use a battery's specified energy where available. Nominal voltage multiplied by Ah is only an approximate nameplate-energy conversion because voltage changes during discharge. For this illustration, accept a hypothetical 12 V, 10 Ah unit as a 120 Wh nameplate-energy input. Assume an allowed discharge-window fraction of 0.80, an independently assessed capacity-availability factor of 0.75 and battery-to-load delivery efficiency of 0.90.
Usable load energy is then 120 × 0.80 × 0.75 × 0.90 = 64.8 Wh. The factors describe different effects: the permitted operating window, capacity available under the assessed condition, and delivery losses. They are not universal values for a particular chemistry. If the supplied capacity is already measured over the permitted window at the operating condition, do not apply those adjustments again.
Now retain an additional operational reserve of 20% of usable energy. Planned consumption may use 64.8 × 0.80 = 51.84 Wh. Three days at 18 Wh/day require 54 Wh, so this example battery fails the three-day requirement with that reserve, although 64.8 divided by 18 gives a no-reserve duration of 3.6 days.
| Hypothetical nominal battery | Usable energy at load boundary | Budget after separate 20% reserve | 54 Wh requirement |
|---|---|---|---|
| 12 V × 10 Ah = 120 Wh | 64.8 Wh | 51.84 Wh | Not met |
| 12 V × 12 Ah = 144 Wh | 77.76 Wh | 62.208 Wh | Met arithmetically |
With these assumptions, the minimum nameplate energy from arithmetic is 54 ÷ (0.80 × 0.75 × 0.90 × 0.80) = 125 Wh. The larger example clears that energy test, but voltage, pulse current, charge limits and temperature compatibility still need confirmation. A larger Ah number alone does not establish suitable valve operation.
5. Size the solar panel for ongoing demand and recovery
For a preliminary comparison, let daily generation at the useful-load-equivalent boundary be panel rated power × peak sun hours × effective delivery factor. The hypothetical factor of 0.60 accounts for the complete applicable path, including the assumed stored-energy route. It is an aggregate scenario input, not photovoltaic cell efficiency. Do not multiply by the battery delivery factor a second time in this generation calculation.
Assume 2 peak sun hours per recovery day and the same 18 Wh/day load. Three days with no useful generation create a 54 Wh deficit. Recovery must replace that deficit while the controller continues operating. Define net recovery energy per day as useful-equivalent generation minus continuing demand.
| Panel rating | Useful-equivalent generation | Surplus after 18 Wh demand | Time to replace 54 Wh |
|---|---|---|---|
| 20 W | 20 × 2 × 0.60 = 24 Wh/day | 6 Wh/day | 9 equivalent recovery days |
| 40 W | 40 × 2 × 0.60 = 48 Wh/day | 30 Wh/day | 1.8 equivalent recovery days |
To target replacement of 54 Wh over two such days, the required panel rating from this simplified model is (18 + 54 ÷ 2) ÷ (2 × 0.60) = 37.5 W. Selecting a hypothetical 40 W option clears the numerical comparison. It does not establish a guaranteed two-day recharge because charge acceptance, voltage matching, regulator limits and the timing of sunlight still matter.
The solar assumption strongly affects the result. At 4 peak sun hours, the 20 W example would supply 48 Wh/day, but substituting that sunnier value would hide the slower recovery at 2 hours. At only 0.5 peak sun hours, even the 40 W example supplies 12 Wh/day and continues losing 6 Wh/day against the assumed load.
6. Check the sequence of low-sun days and equipment limits
Build a time-series energy record starting from a defined usable state. Add energy actually accepted from charging, subtract consumption and cap the result at the usable storage ceiling. Record whenever it falls below the chosen reserve or the equipment's operating endpoint. Energy that arrives while the battery is full cannot be counted as stored credit for a later storm.
Use intervals fine enough to represent important events and charging opportunities. Daily totals can conceal a failed valve command before sunrise even when the day's eventual generation exceeds demand. The generation factor in a daily worksheet is only an approximation to this sequence; detailed analysis should represent the actual charging and discharging paths without duplicate loss factors.
Confirm panel open-circuit voltage over the applicable temperature range, charging-current limits, battery chemistry and temperature settings, controller input range and supported valve loads against the selected equipment documentation. Review cable losses and peak demand separately from daily Wh. Use the controller wiring and test-map guide to keep circuit identities and measurement points consistent.
For integrated solar timers, use the approved configuration and documented autonomy evidence. Do not assume that an internal battery can be replaced with a larger external one or that another panel can be connected. For a separate supply assembly, have the responsible designer confirm the protection, mounting, enclosure and connection requirements of that specific arrangement.
7. Verify irrigation functions during low supply and recovery
Retain the load worksheet, solar-resource assumptions, battery evidence, reserve choice and recovery calculation together. Record the installed hardware and settings so that later changes to reporting frequency, sensors or watering cycles trigger a revised assessment.
Use an approved test procedure to confirm the required opening and closing commands near the planned service boundary. Check documented low-voltage disconnect, reconnect and restart behavior. A latching valve's water state must not be inferred from the controller going dark. Evaluate the actual irrigation response alongside supply voltage and accepted charging energy.
The irrigation alarm planning guide helps assign a practical response to low supply or inadequate recovery. Trend the relevant observations over consecutive days: one bright midday voltage reading cannot establish that the previous overnight duty was completed or that the intended battery reserve was restored.
8. Questions about solar-powered irrigation controller sizing
Does a solar irrigation controller work at night?
It can if the approved energy-storage arrangement supports the required night duty and valve commands. A panel's presence alone does not establish that capability. Check the actual controller's supported configuration and usable storage.
Will a larger battery fix a panel that supplies too little energy?
It can extend the time before stored energy is depleted, but it cannot correct a persistent generation deficit. The panel must cover ongoing demand and the required recovery while respecting the charging limits.
Is the least sunny month always the correct design month?
No. Compare generation with the load required in each operating period. A less sunny month with little irrigation activity can be less demanding than a brighter month with substantially higher controller and valve duty. Then test adverse day-to-day sequences within the relevant period.