Technical2026-10-14
Treat a soil-moisture spike as a real irrigation event only when its timing, direction, depth sequence and neighboring evidence agree. A valid wetting event normally begins after water starts, reaches the shallow sensor before deeper sensors, persists beyond one sample and fits the applied depth. A one-sample jump, an impossible value, a simultaneous change at every depth or a step with no hydraulic explanation should remain flagged as a possible sensor or data fault until it is checked.
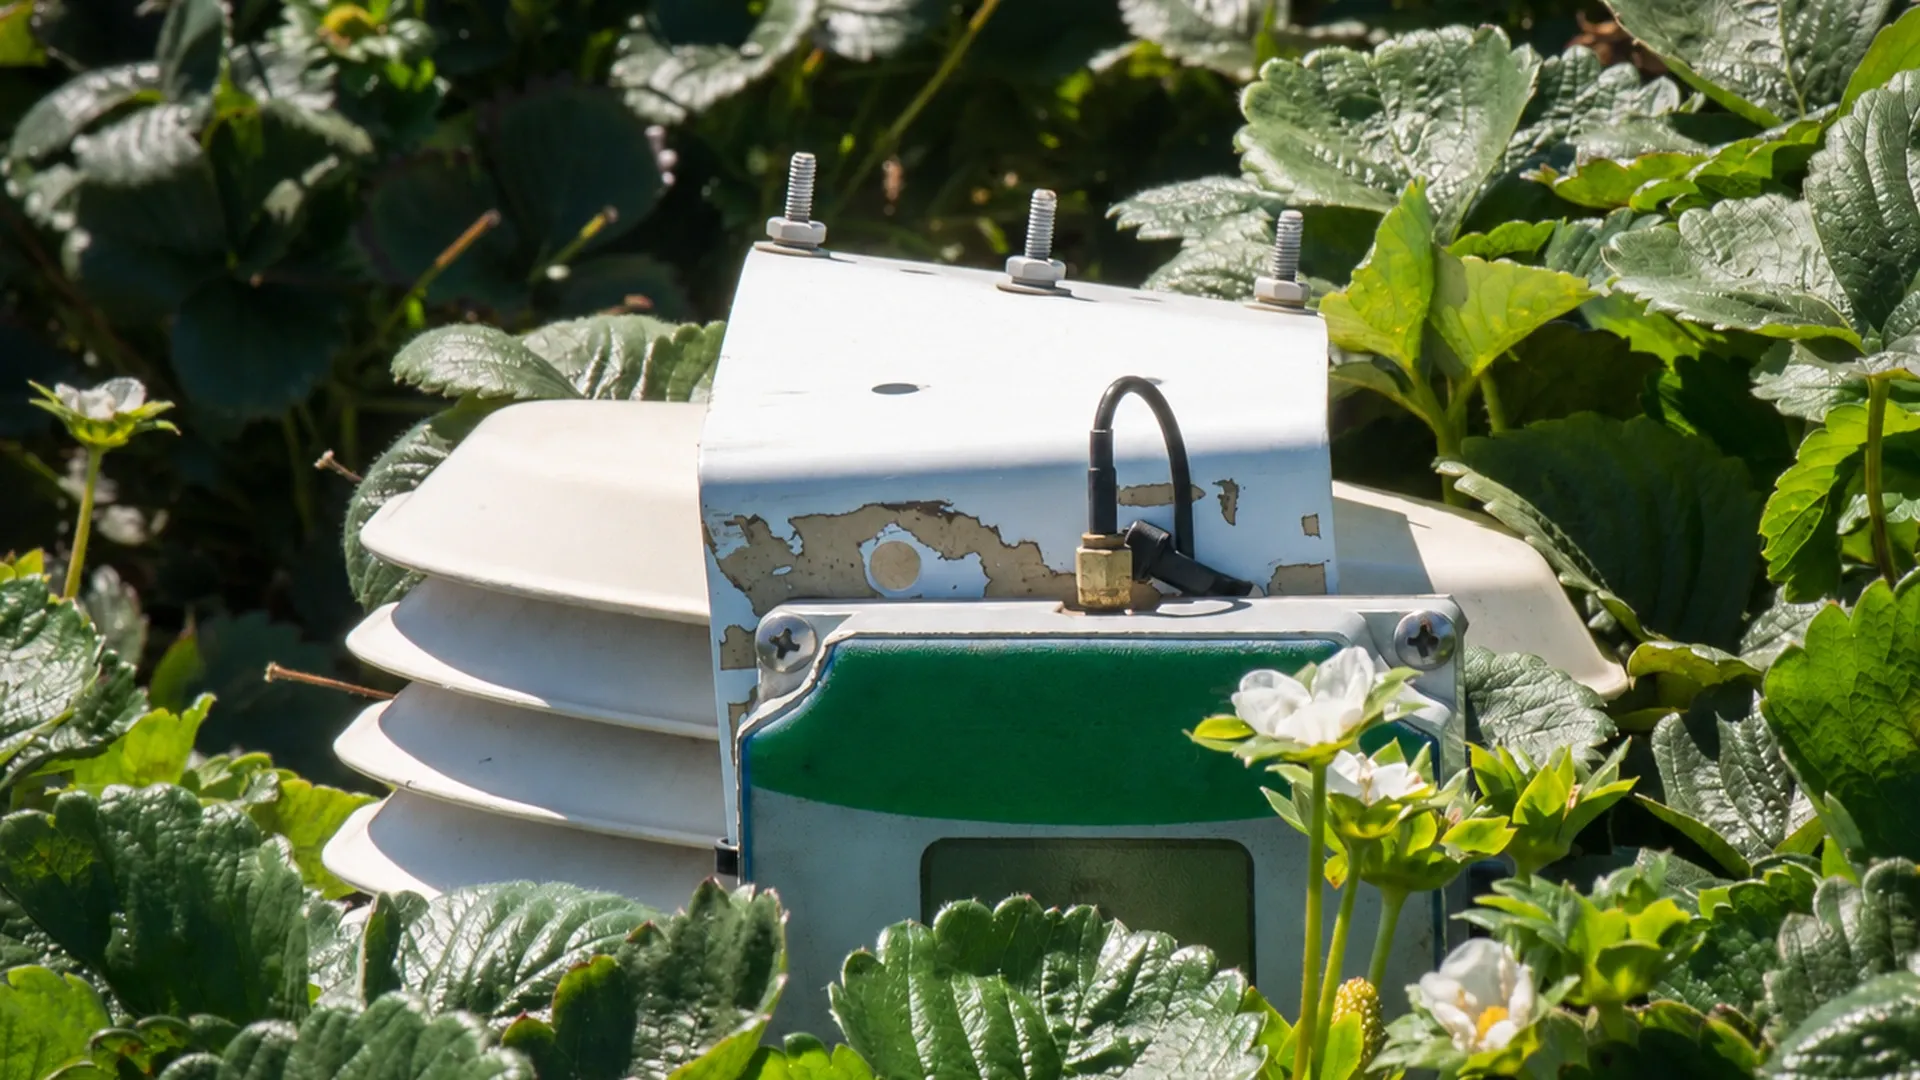
A field monitoring enclosure stands among strawberry plants at a California farm that used buried soil tensiometers and wireless irrigation monitoring. The photograph shows real agricultural monitoring equipment, but it does not prove any diagnostic pattern in this guide. Photo: Lance Cheung / USDA, public domain. The product lettering was removed with a limited AI edit; the image was then cropped and resized.
This workflow is for remote moisture monitoring in irrigated fields. It helps an operator distinguish rainfall and irrigation responses from poor soil contact, a disturbed probe, cable or power trouble, telemetry gaps, unit changes and values pinned at an instrument limit. It does not replace the sensor manual, field calibration, safe excavation or an agronomist’s local irrigation threshold.
Start with independent records. Export the IrriNex IRX-OOCV hydraulic control valve command, pump run, flow total, rainfall, fertigation, maintenance and sensor data on the same time base. Record the time zone, sampling interval and any dashboard aggregation. A chart labelled in local time can appear displaced from a controller log stored in UTC. A five-minute sensor average also cannot be compared sample-for-sample with an hourly flow total without aligning their boundaries.
Create one row for every candidate event. Include its start and stop times, zone, expected sensor station, applied volume or depth, rainfall source, and operator notes. Do not first label the moisture peak as “irrigation” and then search for a matching command. That reverses the test and encourages confirmation bias.
The newest Oregon State University Extension technical guide says reliable interpretation depends on placement, soil contact, representative management zones, several depths, irrigation and rainfall records, and field observations. Its soil-moisture monitoring guide for irrigation scheduling is the sole public external reference linked here.
A volumetric-water-content sensor usually moves upward when water reaches its sensing volume. A tension sensor responds in the opposite numerical direction: as soil becomes wetter, suction or tension generally falls toward zero. Confirm the measurement type and unit before calling an upward line “wet.” For an independent estimate of crop demand rather than a second reading from the same probe, use the evapotranspiration field water-budget guide.
A plausible irrigation signature has four parts:
The delay is site-specific. Drip spacing, IrriNex EMT-PC dripper flow, sensor distance from the emitter, soil texture, preferential flow and antecedent moisture all matter. Do not hard-code one universal number of minutes. Establish a normal response envelope from verified events at that station.
A moisture trace is stronger evidence when an independent hydraulic measurement agrees. For irrigation, look for pump runtime, valve position and measured flow through the correct zone. A controller command alone does not prove delivery. For rain, compare an on-farm gauge or a suitable nearby station with the sensor time series, while allowing for local variability and interception.
Use spatial agreement carefully. Two stations in the same management zone should show related trends, but not identical values. Soil texture, elevation, crop cover and emitter proximity create real differences. Exact simultaneous jumps to the same number across many stations can be more suspicious than modestly different responses.
| Evidence | Supports a real event when | Raises doubt when |
|---|---|---|
| Controller and valve log | The correct zone ran during the expected window | Only a command exists, or the wrong zone is recorded |
| Flow or volume | Delivered water is measured and broadly fits the planned application | No flow was measured, or flow occurred outside the candidate event |
| Rain gauge | Rain timing and amount can explain the response | The nearest station is distant or records no relevant rain |
| Multiple depths | Response order follows a plausible wetting front | All depths jump in the same sample without a credible pathway |
| Neighboring station | The trend is consistent with the same management zone | Only one station changes while independent water evidence is absent |
| Field check | Soil feel, emitter operation and crop condition support the trace | Dry soil or failed delivery contradicts the dashboard |
A value that jumps and returns at the next sample is rarely enough to establish a wetting event. Check raw readings before dashboard smoothing, the logger status, supply voltage, connector condition and radio retransmissions. Do not delete the point silently. Flag it, preserve the original and record the rule used to exclude it from decisions.
A new baseline that begins after cultivation, traffic, maintenance or freeze-thaw may indicate disturbed soil contact, a shifted probe, a new air gap or a configuration change. A lasting step at exactly midnight or after a software update can also reflect unit, calibration or data-processing changes. Compare the device configuration before and after the timestamp.
An unchanging value can represent stable soil, but a long string of identical values is suspicious when weather, crop use or irrigation should cause movement. Check whether the value equals the sensor minimum, maximum, a missing-data substitute or the last-known reading. A flat dashboard does not prove the field stayed unchanged.
Rapid oscillation can come from intermittent wiring, weak power, electrical interference, poor contact or aggressive rounding. Values below zero volumetric water content, above physically possible porosity, or outside the stated sensor range should be quarantined rather than clipped into a plausible band. Salinity and temperature can also bias some sensing methods. If water quality is a plausible influence, document conductivity and temperature using the irrigation water-testing workflow rather than assigning the spike to salinity from the chart alone.
The table below is hypothetical. It shows 15-minute readings from volumetric-water-content sensors at 20 cm and 50 cm depth. A neighboring station is in the same irrigation zone. The numbers are teaching data, not a field result, target or sensor specification.
| Time | Hydraulic record | 20 cm VWC | 50 cm VWC | Neighbor 20 cm | Interpretation |
|---|---|---|---|---|---|
| 05:45 | No flow | 0.214 | 0.247 | 0.208 | Drying baseline |
| 06:00 | Valve command; flow begins | 0.215 | 0.247 | 0.208 | Water has not reached either station |
| 06:15 | Stable zone flow | 0.252 | 0.247 | 0.238 | Plausible shallow wetting at both stations |
| 06:30 | Stable zone flow | 0.279 | 0.249 | 0.263 | Shallow response persists; deep front just begins |
| 06:45 | Flow stops | 0.286 | 0.258 | 0.271 | Depth order and flow evidence agree |
| 07:00 | No flow | 0.281 | 0.267 | 0.268 | Drainage and delayed deep response are credible |
| 11:15 | No flow or rain | 0.398 | 0.266 | 0.258 | Isolated one-sample spike; hold as suspected fault |
| 11:30 | No flow or rain | 0.270 | 0.265 | 0.257 | Immediate return supports the fault flag |
The 06:15–07:00 pattern is consistent with irrigation because measured flow, two stations, the wetting direction, persistence and depth order agree. The 11:15 value is not accepted as irrigation: it occurs without water evidence, affects one channel only and disappears in one interval. The correct conclusion is “suspected data or sensor fault pending inspection,” not a guessed component failure.
When field samples are needed, follow a consistent depth and distance from the emitter. Compare them with the sensor under the same soil and temperature conditions. Keep verification distinct from changing a coefficient; the same record boundary is explained for another sensor class in the EC and pH sensor calibration and verification guide. Apply the soil-moisture probe’s own approved method.
Review the original station map before digging. Confirm probe depth, orientation, distance from the water source, soil horizon and cable route. The remote moisture-monitoring placement guide shows how representative and deliberately wet or dry positions serve different decisions.
Inspect above-ground equipment first: enclosure seals, condensation, cable strain relief, animal damage, solar exposure, battery condition, connectors and antenna. Compare the serial number and port assignment with the asset record. A swapped channel can produce good-looking data from the wrong depth.
Excavate only under a safe procedure that protects buried irrigation, electrical lines and the probe. Do not pull on the cable. Check for voids, roots, cracks, preferential channels, disturbed backfill or a probe that has moved. If removal is necessary, document the old condition and treat reinstallation as a new baseline.
Use separate flags for raw validity and agronomic meaning. A reading can be technically valid yet unrepresentative of the management zone; it can also be agronomically plausible while carrying a logger error. Preserve both dimensions.
| Rule type | Example test | Safe system action |
|---|---|---|
| Range | Outside the documented sensor or physically credible range | Flag invalid; retain raw value; block automatic irrigation response |
| Rate of change | Change exceeds the station’s verified wetting envelope in one sample | Request corroboration from flow, rain or another depth |
| Persistence | Spike disappears at the next interval | Mark transient; do not rewrite historical data |
| Flatline | Identical values persist despite known water use or irrigation | Open an inspection task and use another scheduling method |
| Cross-sensor | Deep response precedes shallow response without a credible pathway | Review channel mapping, depth records and preferential flow |
| Communication | Missing samples, stale timestamp or repeated last-known value | Show data age clearly; do not present stale data as current |
Thresholds must be based on each station’s sensor range, sample interval and verified field behavior. A rate limit copied from another soil or sensor can suppress a real event. Test rules against labelled historical events and record false positives and false negatives before permitting any automatic control.
For each anomaly, record station and channel, timestamp, raw value, previous and next values, quality flags, irrigation and rainfall evidence, relevant depths, field observation, action, replacement or configuration details, and closure result. Attach the chart and raw export. Never keep only a screenshot whose scale or time zone is unknown.
When the sensor is unreliable, state which fallback will guide irrigation: another verified station, soil feel and appearance, a water-balance check, crop observation, or a qualified adviser’s temporary plan. The remote irrigation alarm guide helps assign ownership and escalation without turning every outlier into a pump command.
Close the incident only after evidence shows the signal has returned to expected behavior. Record a controlled wetting event after repair or reinstallation and compare it with flow, depth order and a neighboring station. Keep the old baseline separate when location, soil contact, sensor type or calibration changes.
No. Require corroborating timing, persistence, hydraulic delivery and a plausible depth sequence. A single point can be a transient data fault.
It can happen through preferential flow, subsurface drip placement, run-on, a perched layer or different sensor positions. Investigate the installation and hydraulics before declaring the channel mapping wrong.
Keep the raw value and add a quality flag. Excluding it from an irrigation calculation may be appropriate under a documented rule, but silent deletion destroys evidence.
There is no universal count. Use enough locations and depths to represent the management zone and its variability. Agreement should be in timing and pattern, not identical numbers.
Disable or constrain automation when the controlling signal is stale, out of range, flatlined, unverified after maintenance, or contradicted by independent evidence. Use the approved fallback until a controlled test closes the fault.
Classify a spike as a real irrigation or rain response only when the water event, measurement direction, response persistence, depth order and independent evidence form one coherent explanation. If any essential link is missing, preserve the raw data, flag the event, inspect the station and use a documented fallback. A cautious “unresolved” classification protects the crop better than a confident label built from one attractive chart.
A sharp, rapid vertical rise occurring 15 to 45 minutes after the zone valve opens (dependent on sensor depth), followed by a curved exponential drainage plateau (Field Capacity transition) over 6 to 12 hours, followed by a steady diurnal root extraction decline.
An instantaneous spike to 100% saturation simultaneously across deep sensors (e.g. 60 cm spiking at the exact same minute as 10 cm), followed by an immediate steep drop within 30 minutes of water shutoff, proving water channeled down the plastic shaft rather than through soil pores.
Electrical noise or radio telemetry packet corruption. Physical soil moisture cannot rise by 15% and drop 15% within a single 15-minute logging interval. Automated software filters should scrub these isolated single-point anomalies.
The sensor flat-lines to maximum value ($100\%$ VWC / short circuit) or drops instantly to zero ($0\%$ / open loop), or displays erratic full-scale oscillations as exposed copper conductors intermittently touch damp soil.
Products relevant to this irrigation guide.
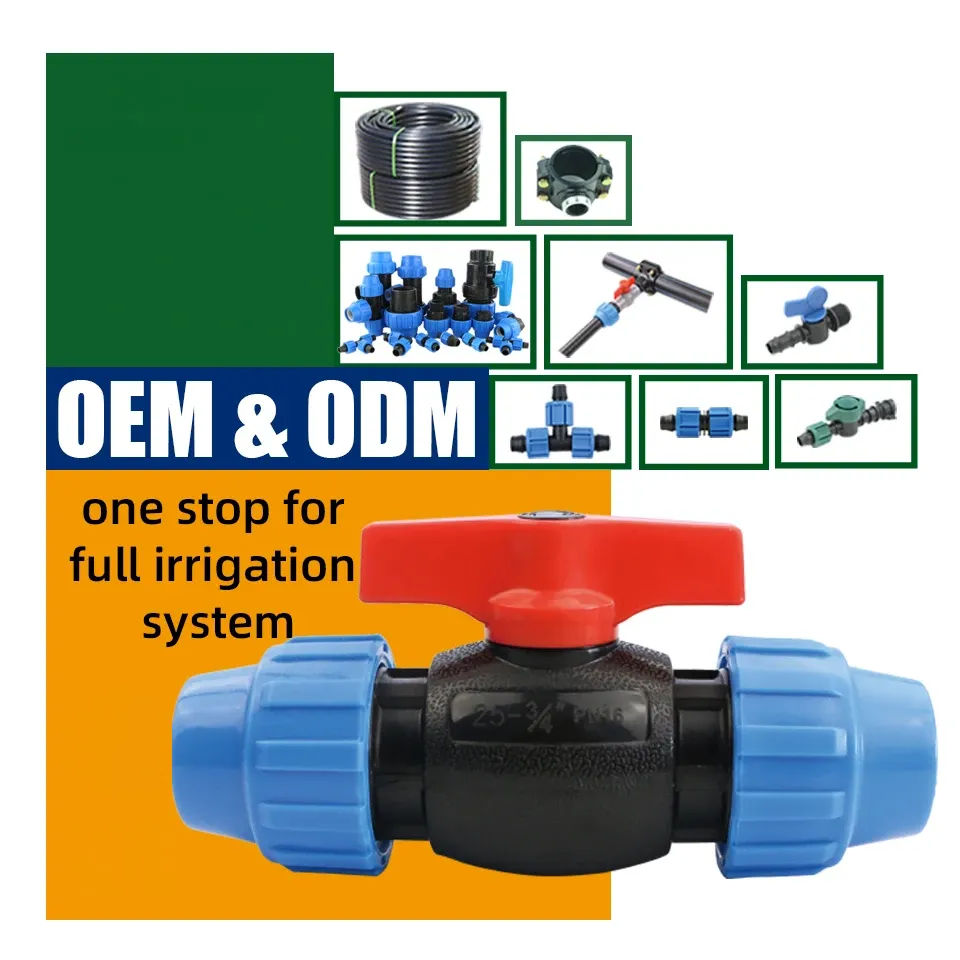
IRRINEX irrigation valve. power: Manual; Size: 20mm-63mm; Working pressure: 16 Bar; Connection: Threaded Connection. An irrigation valve forms part of the system's flow-control arrangement. The named valve form and its actual connections should be checked before choosing a configuration.
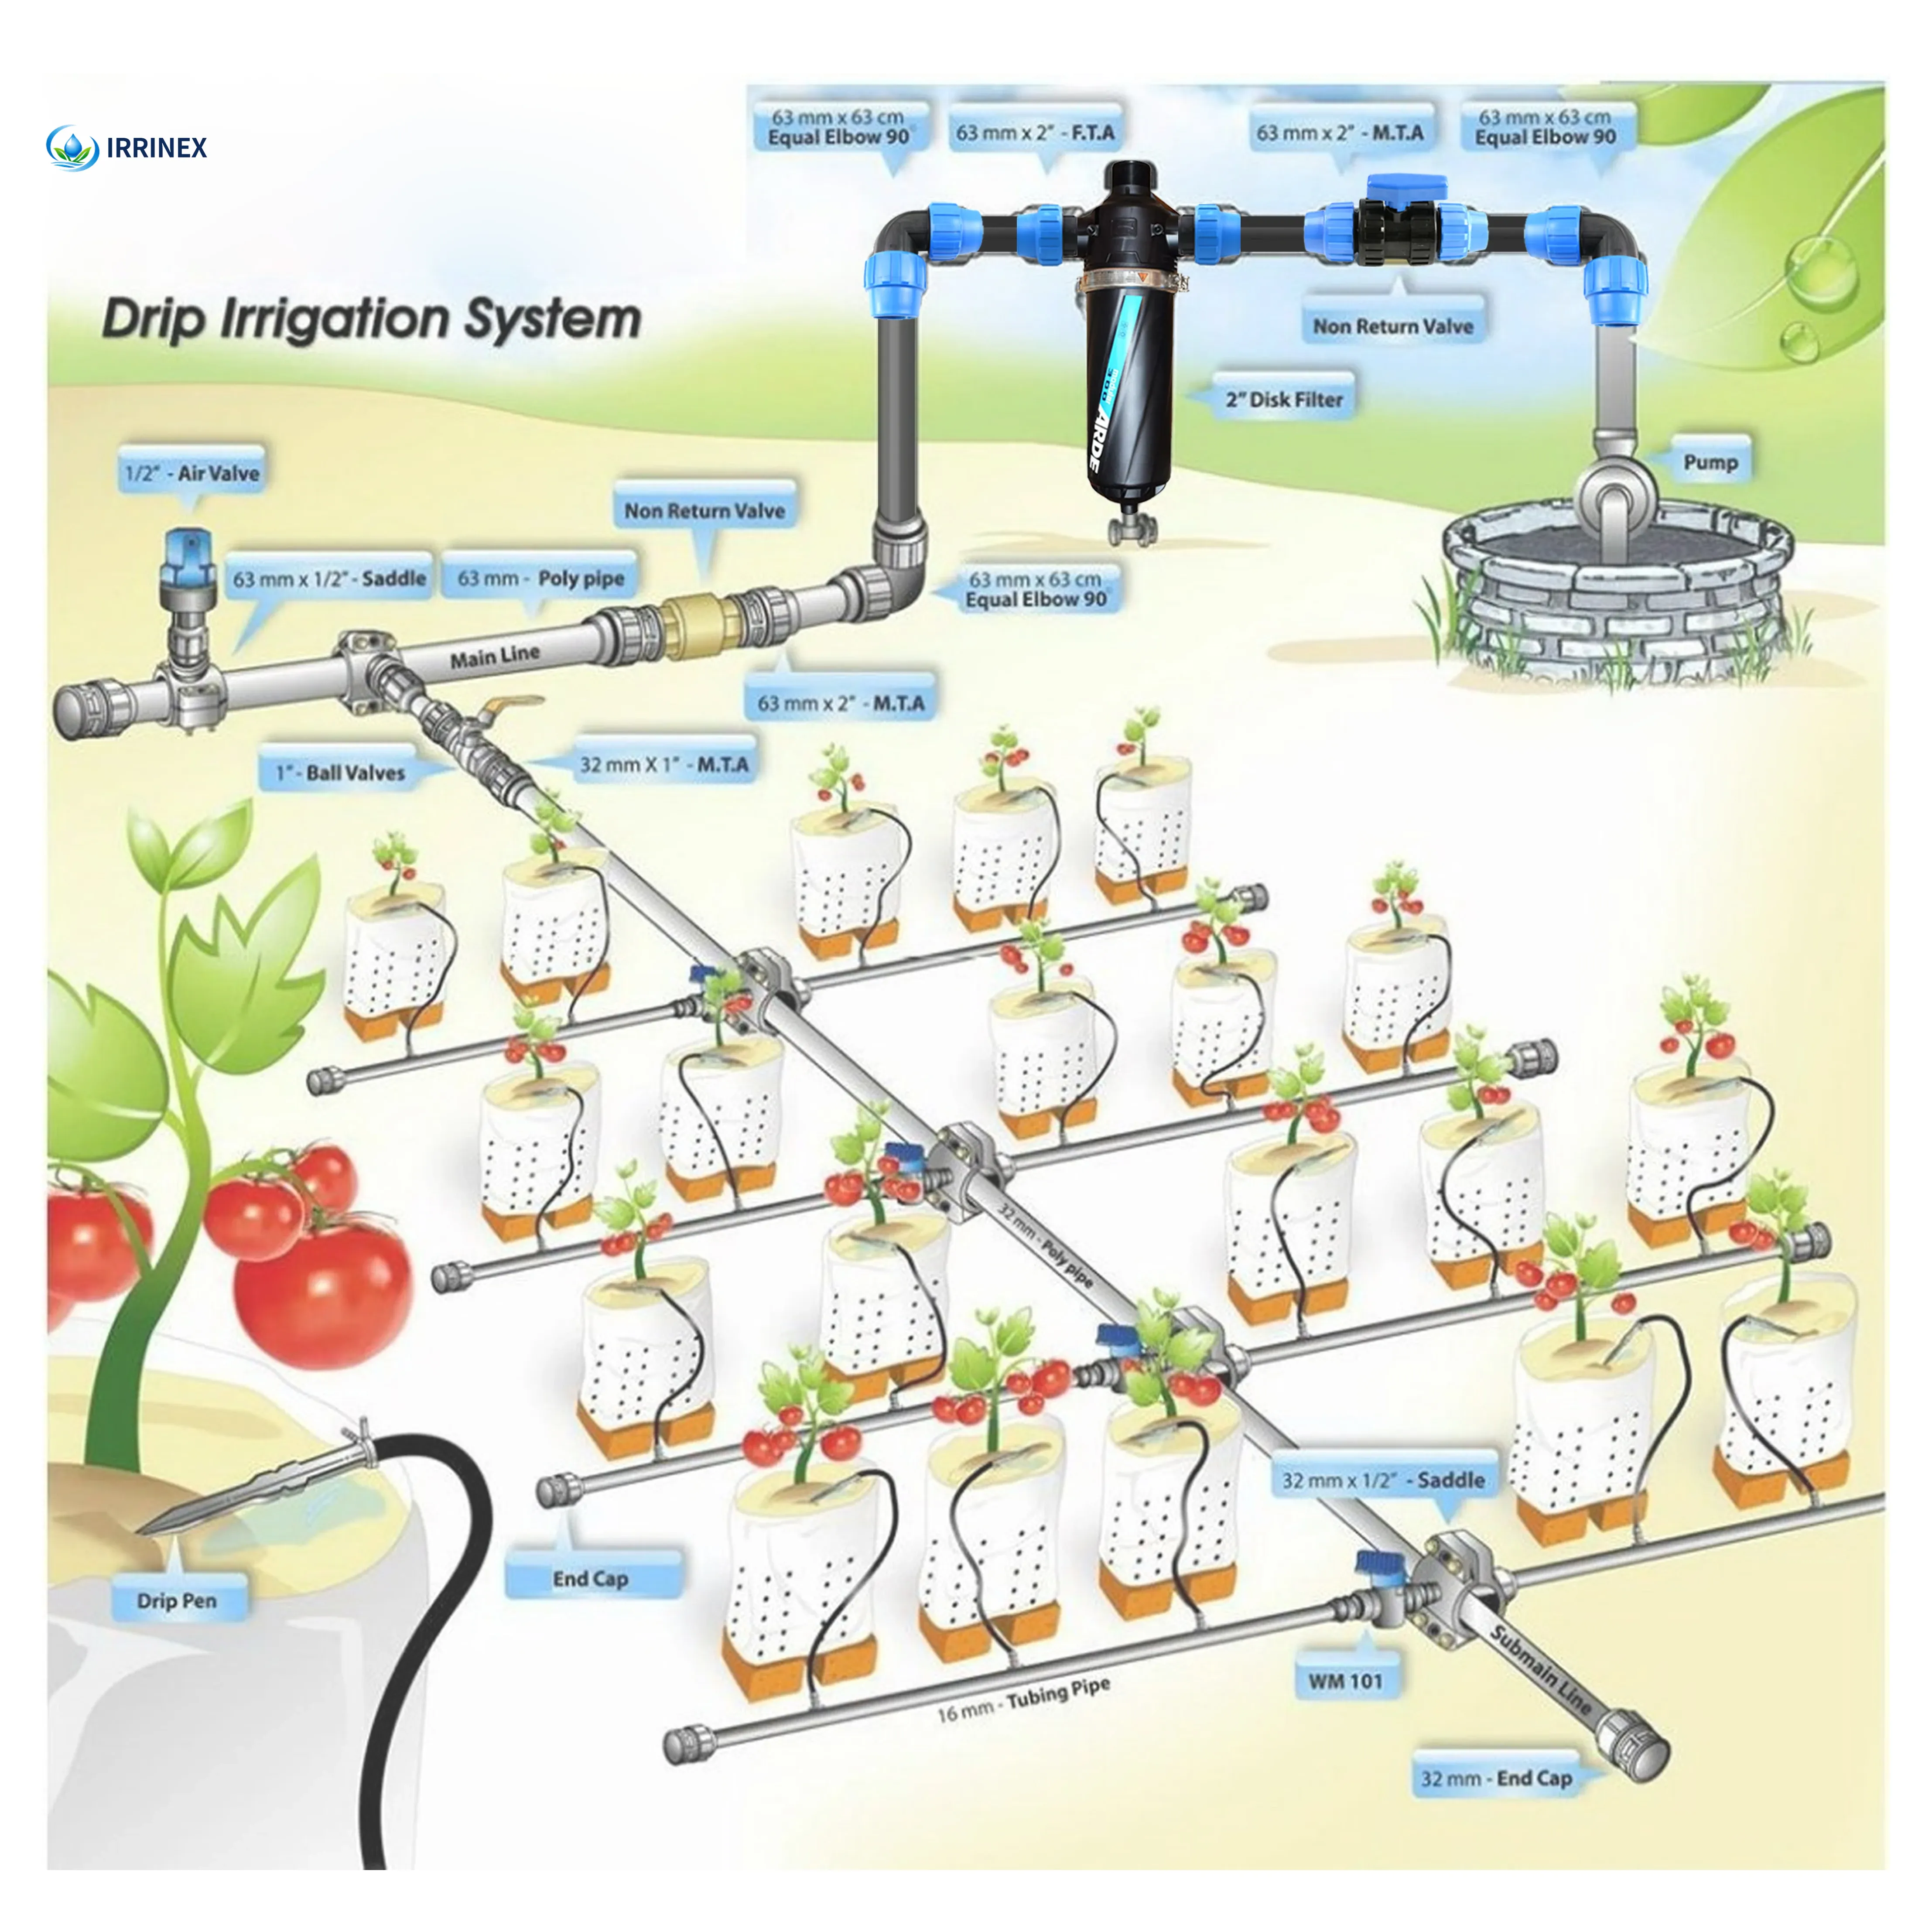
IRRINEX irrigation system offering. Size: 16mm; Thickness: 0.2-0.6mm; Roll length: 500m; Working pressure: 1-3Bar. An irrigation system offering should be configured around the intended site and crop. Listing scope does not establish a complete bill of materials or guarantee area coverage.
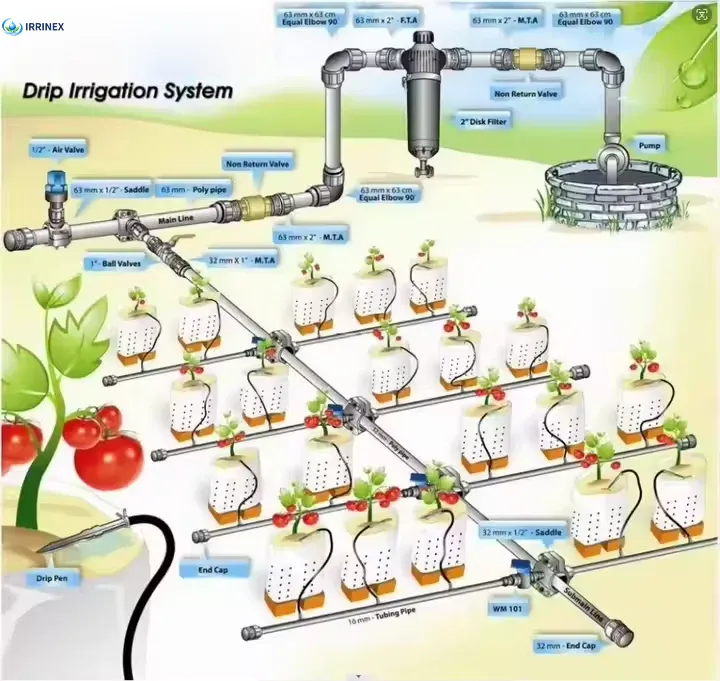
IRRINEX irrigation system offering. Diameter: 16mm. An irrigation system offering should be configured around the intended site and crop. Listing scope does not establish a complete bill of materials or guarantee area coverage.

IRRINEX drip irrigation tape. Diameter: 16mm; Size: 16mm or customized; Pressure: 1bar. Drip tape forms a lateral watering component with a selected outlet arrangement. Diameter, wall thickness and emitter options should be checked as one exact configuration.