
Technical2026-10-19
Plant-based irrigation monitoring works best as a three-way check: dendrometers show how stems or fruit contract and recover, canopy-temperature sensors show the crop's short-term cooling response, and soil sensors show whether water is present in the measured root zone. None of the three is a stand-alone irrigation command. Establish a crop- and block-specific baseline, align timestamps, confirm that irrigation actually reached the zone, and change a schedule only when the plant, soil and hydraulic evidence tell a consistent story.
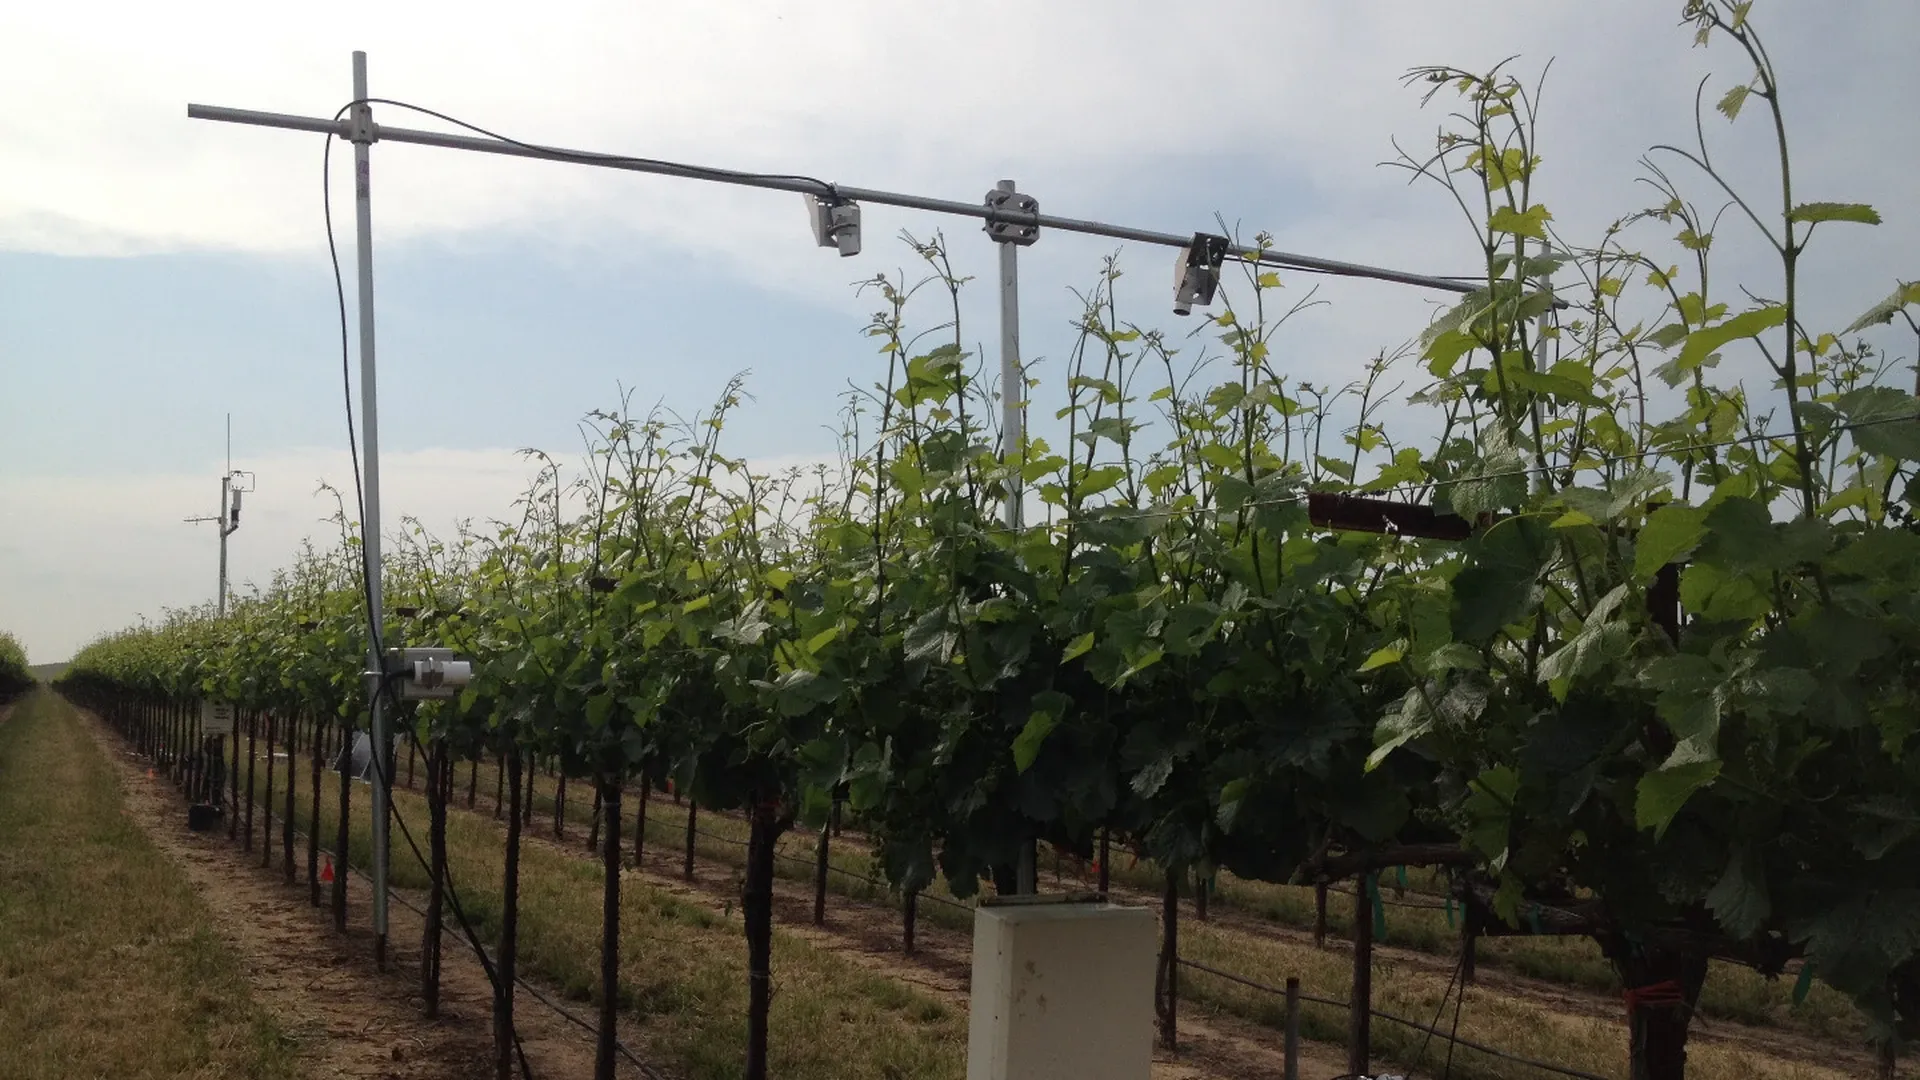
Infrared radiometers point at a vineyard canopy while a data enclosure and drip laterals remain visible in the same real agricultural field. The photograph documents the equipment context; it does not prove a universal stress threshold or product result.
This guide is a commissioning and interpretation method for permanent crops and field crops. It helps an irrigation manager compare signals without turning a single spike into an automatic IrriNex IRX-OOCV hydraulic control valve command. It does not replace the sensor manual, crop adviser, pressure chamber, flow measurement, or a local calibration trial.
Write the decision in operational terms: start the next irrigation, extend or shorten a run, split a set, investigate a weak zone, or evaluate recovery after irrigation. Also write the decision horizon. Canopy temperature can change within minutes, stem diameter follows a daily cycle, and soil water can move past a probe over hours or days. A dashboard cannot reconcile those time scales unless the team states which question each channel answers.
Define the management unit: cultivar, rootstock, soil type, planting year, irrigation zone and representative plant population. A sensor on one vigorous border tree should not control a mixed block. The University of California irrigation-scheduling guidance treats direct plant measures and soil moisture as useful evidence while warning that equipment is delicate and tree-to-tree variation still requires field observation. That is the correct starting point: measurement supports judgment, and replication limits false confidence.
Document crop stage and the reason for monitoring. A young orchard being established, a mature block under regulated deficit irrigation and a vegetable field near harvest can respond differently to the same apparent stress. Set a review cadence and name the person authorized to change runtime.
A dendrometer records a change in organ diameter at one attachment point. A canopy-temperature sensor records thermal radiation from a field of view that may contain leaves, fruit, soil and sky. A soil sensor records a property around its sensing volume at a particular depth. These are related to crop water status, but they are not three versions of the same measurement.
| Channel | Primary observation | Useful pattern | Cannot establish alone |
|---|---|---|---|
| Dendrometer | Micrometre- or millimetre-scale diameter change at one stem, trunk or fruit | Daily contraction, overnight recovery and longer-term growth trend | Root-zone water distribution, IrriNex EMT-PC dripper discharge or a universal stress limit |
| Canopy temperature | Surface temperature over the sensor field of view | Crop-to-air temperature difference at comparable radiation, wind and time | Cause of heating when canopy cover, disease or weather also changed |
| Soil water | Volumetric content, matric potential or another calibrated soil property | Wet-up, depletion rate, active rooting depth and irrigation penetration | Whole-block plant response or water beyond the sampled location |
| Flow and pressure | Whether the hydraulic system delivered water as commanded | Start/stop time, applied volume and abnormal zone performance | Whether the crop used the delivered water |
The fourth row matters. Plant-based monitoring becomes actionable only when it is paired with delivery evidence. Use a verified meter, pressure record or valve feedback to separate crop response from a failed irrigation event.
Divide the field into management zones before choosing plants. Include known differences in soil texture, slope, rootstock, canopy size, yield history and hydraulic performance. Put the primary station in a representative area, then add a deliberate contrast station in a dry, heavy-soil, high-elevation or weak-pressure area. A reference or well-watered treatment can be valuable when it is maintained and documented.
For soil probes, map emitter distance, depth and installation disturbance. The soil-sensor placement guide explains why one probe beside one emitter cannot represent a whole root zone. For canopy sensors, map viewing angle, target rows, sun direction and fractional canopy cover. For dendrometers, record plant number, attachment height, organ diameter and bark condition.
Use at least one independent field observation during commissioning: hand soil samples, pressure chamber measurements where appropriate, visual canopy condition, emitter checks, flow and pressure. The aim is not to force agreement. It is to understand why the sensors disagree before an expensive irrigation decision depends on them.
Mount the frame firmly without constricting the organ. Select a sound, representative surface and follow the allowed diameter range, temperature compensation and maintenance instructions. Protect cable loops from wind, workers and machinery. Record the raw output before any smoothing. After installation, inspect for slip, bark swelling, growth beyond travel, debris, condensation and abrupt steps caused by service.
Measure the viewing geometry rather than aiming by eye. Keep the intended canopy in the field of view as plants grow, and minimize soil, sky, posts and irrigation water. Check lens cleanliness and mounting movement. Record air temperature, solar radiation and wind because the same crop can show a different canopy-to-air temperature difference under different weather. Compare like clock windows and like exposure.
Install through soil that represents the zone and avoid air gaps, preferential flow down the access hole, rocks and recently disturbed wet pockets. Record actual depths and soil texture. Confirm a wetting response after a known irrigation, then compare sensor trends with field samples. Treat manufacturer calibration as a starting point when soil salinity, clay and bulk density may affect readings.
Synchronize logger, controller, weather station and flow-meter clocks to one declared time zone. Preserve raw timestamps and units. Record valve command, measured start, flow, pressure, duration and applied volume. A five-minute clock offset can make a plant response appear to precede irrigation and can corrupt lag-time analysis.
A trunk or stem often expands overnight and contracts during the day as transpiration temporarily exceeds root water supply. Calculate daily maximum shrinkage from the day's maximum and minimum diameter, but also track overnight recovery and multi-day growth. Increasing contraction with incomplete recovery can be a warning; a single large contraction can also reflect heat, wind, loose mounting or work on the plant.
For canopy temperature, compute ΔT = canopy temperature − air temperature using synchronized values. Evaluate a stable midday window only when radiation, wind and canopy cover are comparable. A warmer canopy can be consistent with reduced transpirational cooling, but soil background, sparse stands, disease, stomatal behavior and sensor angle can produce the same sign.
For soil data, identify the pre-irrigation trend, wetting front, redistribution and subsequent depletion at each depth. A deep sensor that never responds may be below the active wetting depth, outside the wetted bulb or poorly installed. Translate accepted evapotranspiration inputs through a documented field water-budget method; do not label a plant signal as millimetres of irrigation without a separate water balance.
Compare changes, not isolated dashboard colors. First confirm delivery, then ask whether soil water changed, then inspect plant response at the expected lag. Use the matrix as an investigation order rather than a universal automatic rule.
| Observed combination | Likely interpretation to test | Next check before changing irrigation |
|---|---|---|
| Delivery confirmed; soil wets; plant recovers | Event reached the sampled root zone and the monitored plant responded | Compare applied depth with the planned water budget and check drainage |
| Delivery confirmed; soil wets; plant stays stressed | Response lag, root limitation, disease, salinity, heat load or nonrepresentative plant | Inspect roots and canopy; compare a second plant and next overnight recovery |
| Delivery confirmed; soil does not wet; plant stays stressed | Probe outside wetted volume, preferential flow, shallow application or blockage | Dig or sample across emitter distances; check lateral and emitter discharge |
| No delivery evidence; plant and soil show no response | Hydraulic or control failure is more likely than a scheduling error | Check command, valve position, pressure and meter before adding runtime |
| Canopy warms; dendrometer and soil remain normal | Weather, field-of-view contamination, canopy damage or sensor drift | Check radiation, wind, lens, target cover and neighboring sensor |
Start with a supervised advisory rule. Example: flag a block only when a plant metric departs from its stage-specific baseline for two comparable periods, soil evidence shows depletion or failed recovery, and hydraulic data show the previous event was delivered. The numbers must come from local observations; do not copy a threshold from another cultivar or climate.
Define hysteresis and a minimum decision interval so a noisy signal does not repeatedly start and stop pumps. Set maximum runtime, daily volume and pressure interlocks independently. Where communication is unreliable, the offline-capable smart-irrigation design should keep safe local schedules and retain data for later review.
Run the proposed rule in shadow mode for several irrigation cycles. Log what it would have commanded, compare that with agronomic review, and quantify false alarms, missed stress and unnecessary events. Only then allow bounded automation, with a manual override and an audit trail.
Use spatial replication. If all plant sensors move together under the same weather, the response is more credible. If one jumps while neighboring plants, soil and delivery remain normal, inspect that installation first. If a whole block warms but flow and soil are normal, inspect canopy damage, disease and weather before increasing water.
Use temporal tests as well. A hydraulic event should appear first in flow and pressure, then in soil at a depth-dependent lag, and later in plant recovery. Impossible order, flat-line channels, perfect repeated values and abrupt zero offsets are quality flags. Maintenance events should create annotations, not be silently merged into the crop record.
Do not hide missing data with a continuous line. Mark gaps, substitutions and interpolations. Alarms should state the signal, duration, supporting evidence and required action; the remote irrigation alarm framework shows how to design thresholds operators can act on.
For each station, retain coordinates, zone, cultivar, rootstock, plant ID, sensor model and serial, firmware, installation photographs, depth or mounting geometry, calibration evidence, units, scan interval and time zone. Record irrigation commands, measured volume, pressure, rain, weather, crop stage, field observations and maintenance. Version every derived metric and smoothing rule.
A weekly review should compare raw and processed traces. Sample several declared “normal,” “stress” and “recovery” periods, then verify them against field notes. Keep rejected readings with quality codes. This record supports GEO-friendly, citable statements because a reader can see the method, scope and limitation behind each conclusion.
Which sensor should control irrigation first? None should control it first. Begin with delivery verification and a site water budget, then use soil and plant signals to confirm timing and response. Automation should follow a validated supervised rule.
Can a dendrometer tell how many millimetres to apply? No. It records diameter change. Irrigation depth requires area, flow, runtime, application efficiency and a defensible water-balance calculation.
Is a hot canopy always water stress? No. Canopy cover, radiation, wind, disease, sensor view and air-temperature timing can change the reading. Compare synchronized, like-for-like periods and inspect the crop.
What if soil and plant sensors disagree? Treat disagreement as information. Verify delivery, placement, time alignment, rooting pattern and sensor condition before changing runtime. A second independent observation is more valuable than forcing the curves to match.
Before deployment, write the decision, management zone, baseline period and acceptable evidence. During installation, photograph geometry, synchronize clocks, verify units and test a known irrigation. During operation, check flow and pressure first, review soil wetting second, compare dendrometer recovery and canopy ΔT third, then inspect the field. Before automation, run the rule in shadow mode, impose bounds, record overrides and schedule seasonal revalidation.
The defensible decision is the one supported by delivery, soil and plant response on the same timeline. Dendrometers, canopy temperature and soil data become useful together when each channel retains its proper meaning and every threshold is earned from the monitored block.
Soil sensors measure only moisture availability in the soil, completely ignoring atmospheric vapor pressure demand (VPD), root health, and xylem hydraulic conductivity. Soil can be moist, but on extreme heatwave days, trees cannot transport water fast enough and suffer internal xylem cavitation.
Trees act like giant water capacitors: during peak midday transpiration, trees draw stored water out of their bark and phloem tissues, causing the trunk to physically shrink. Dendrometers measure Maximum Daily Shrinkage (MDS) in micrometers; high MDS indicates water stress.
Transpiration cools leaves like an evaporative air conditioner (transpirational cooling). When a plant experiences root water deficit, it closes stomata to save water, halting evaporative cooling. Canopy temperature spikes 2°C to 6°C above ambient air, signaling acute stress.
Midday Stem Water Potential (SWP) measured using a Scholander Pressure Chamber ('Pressure Bomb'). Bagged shaded leaves are placed in a pressure vessel to measure exact xylem suction pressure in Megapascals (-0.8 to -1.8 MPa).
Products relevant to this irrigation guide.
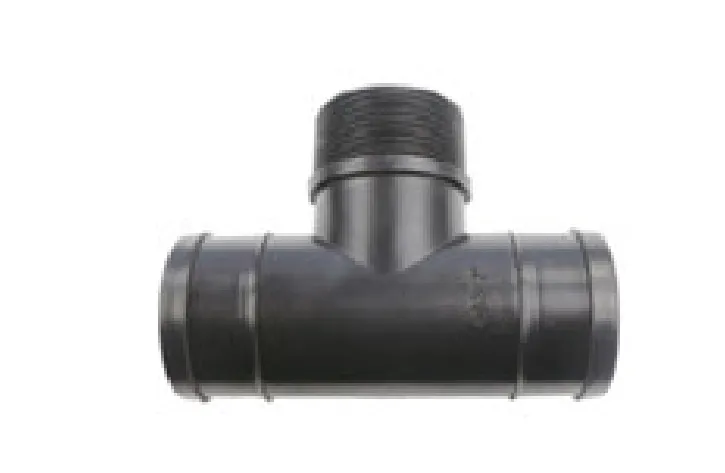
Tee with Middle Male Thread with catalogue-backed technical fields clearly documented. Compare the exact record, variant and project requirements before a technical enquiry.
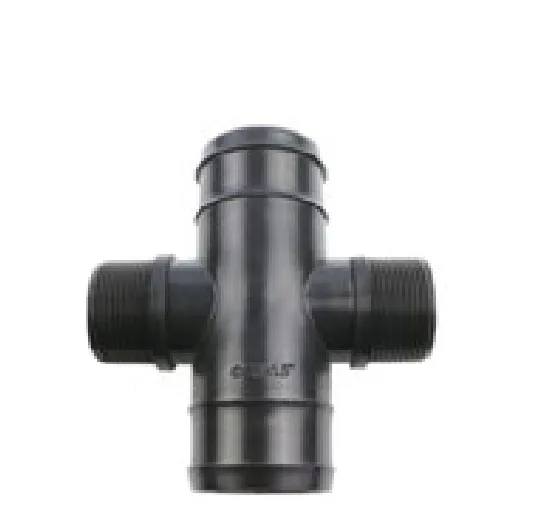
Cross with Middle Male Thread with catalogue-backed technical fields clearly documented. Compare the exact record, variant and project requirements before a technical enquiry.
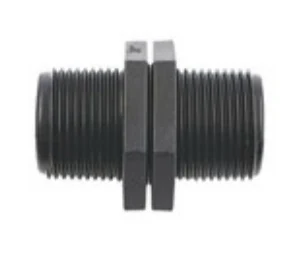
Nipple with catalogue-backed technical fields clearly documented. Compare the exact record, variant and project requirements before a technical enquiry.
Plastic Clip with catalogue-backed technical fields clearly documented. Compare the exact record, variant and project requirements before a technical enquiry.

