
Technical2026-11-13
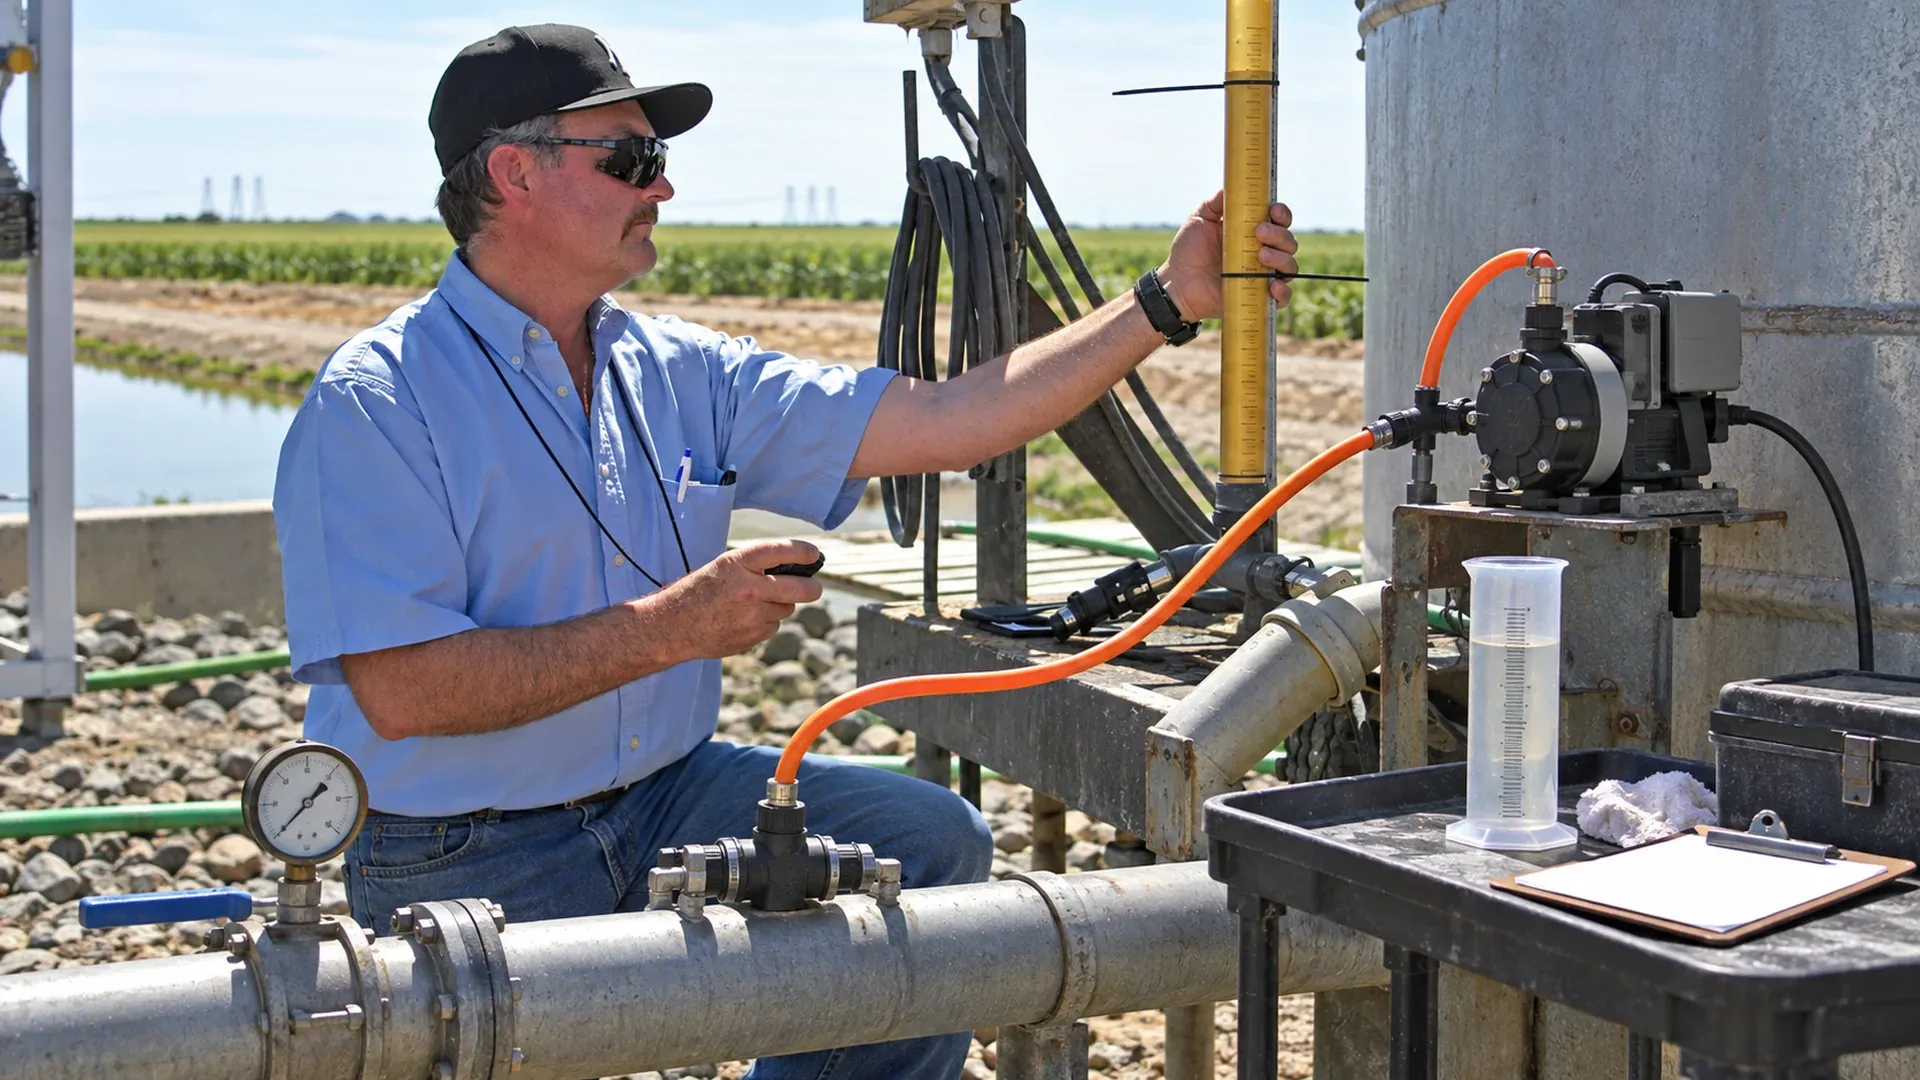
Calibrate a fertigation dosing pump by measuring the volume it actually delivers over a known time while the irrigation system runs at its normal injection pressure, water flow, suction lift and fluid condition. Repeat the measurement, compare the measured rate with the required rate, then adjust and test again. A dial position, nameplate capacity or open-bucket result cannot by itself establish installed delivery.
This guide builds a usable calibration curve from three settings at two pressures. The worked measurements are an original, hypothetical training example, not results from a farm trial or a certification of any pump. Use an acceptance limit agreed for your crop, product and equipment before testing; the example limits below are deliberately project-specific.
Five quantities often get confused: the target injection rate, the pump control setting, the delivered stock-solution rate, the mixed-water concentration and the dose reaching individual emitters. Pump calibration links the second quantity to the third under recorded conditions. It does not prove that the stock recipe is correct, that the irrigation water meter is accurate or that all plants receive the same dose.
Begin with the approved nutrient plan and calculate the required injection rate. For a constant stock rate, state the target in L/h. For a proportional injector, state the concentration-to-water ratio and identify its denominator: carrier water alone or final mixed solution. A setting labelled “1:100” needs the equipment's definition before it can be tested.
Record the duration of the injection window separately. A pump delivering 12 L/h for 45 minutes supplies 9 L of stock; it does not supply 12 L. A correct hourly rate with an incorrect run time still produces the wrong event dose.
Stabilize the actual irrigation zone before taking readings. Check pressure close to the pump discharge and injection point, rather than relying on a distant mainline gauge. Note the gauge location because a check valve, lance and connecting hose can add resistance between those points. Record water flow, stock-tank level, suction lift and temperature; keep them reasonably constant through each group of repeats.
University of Georgia Extension's drip chemigation guidance supports on-site measurement with a fully charged system at the pressure used for injection. Reproduce injection height and avoid air in the lines. The checklist and numerical acceptance method here are an operational example, not a university-prescribed tolerance.
| Method | What is measured | Critical boundary |
|---|---|---|
| Suction drawdown, including an installed calibration column | Known volume removed in a timed interval, or time to remove a known volume | Discharge remains connected to the operating line; preserve suction conditions and prevent the vessel running dry. |
| Pressure-side collection | Collected discharge volume during a known time | A qualified test arrangement reproduces normal backpressure. Open discharge is only a preliminary check. |
| Carrier-water ratio test | Concentrate draw and verified water volume during the same interval | Use the actual zone and injector flow range; distinguish carrier volume from collected mixed volume. |
A properly installed calibration column lets the pump continue discharging into the working main. Follow the approved valve sequence, fill and prime the column, record its initial reading and start timing as the pump draws solely from that measured supply. Stop before the liquid reaches the suction inlet. The decrease in volume is the drawdown. Refill to a comparable starting level for each repeat so changing suction head does not become a hidden variable.
Do not infer volume from liquid height without a valid height-to-volume calibration. A tapered tank, connected sight tube or second connected vessel changes the volume represented by each millimetre. Check that no refill, return, leak or other outlet contributes to the measured decrease. Drawdown represents delivered volume only when those alternative flow paths are excluded and priming is complete.
Use a compatible receiving vessel and an engineered arrangement with suitable backpressure control, relief and containment. Connection changes require isolation and depressurization first. After safely restoring the test system, confirm the actual pump discharge pressure during collection. Never create resistance by improvising a blocked hose, and never disconnect a pressurized chemical line to begin a test.
A water-driven injector must be tested while its motive-water flow is within its allowed range. If it draws 2.00 L while a verified upstream meter records 1,000 L of carrier water, the stock-to-carrier ratio is 0.200%. If instead the measured denominator is 1,000 L of final mixture, the stock fraction of that mixture is 0.200%, and the carrier volume is 998 L. Name the basis in the record.
University of Maryland Extension distinguishes ratio testing from electrical-conductivity testing. EC is a useful downstream concentration check only with a calibrated sensor, appropriate sampling, source-water baseline and a product-specific concentration relationship. EC does not independently measure pump displacement or identify each nutrient. Use the separate guide to verify EC and pH sensor measurements.
Q = ΔV / Δt. With drawdown ΔV in mL and elapsed time Δt in seconds, Q in L/h = 3.6 × ΔV / Δt. For 930 mL in 300 seconds, Q = 11.16 L/h. Divide L/h by 3.785411784 to obtain US gal/h: this result is about 2.95 US gal/h. State US gallons explicitly; an imperial gallon is a different unit.
Error (%) = 100 × (Qmeasured − Qtarget) / Qtarget. Against a 12.00 L/h target, 11.16 L/h gives −7.0%, meaning underdelivery. A first proportional setting estimate is Snew = Sold × Qtarget / Qmeasured. At a current setting of 60%, this gives 60 × 12 / 11.16 = 64.5%.
This is an estimated adjustment, not proof of a linear response. Washington State University Extension's FS230E uses repeated volume-and-time checks and a longer final verification. If the required estimate exceeds the permitted adjustment range, stop and assess capacity, restrictions and operating conditions; do not treat an impossible control value as a solution.
Assume a primed metering pump using the same approved test liquid at 20°C, a fixed suction arrangement and steady carrier-water flow. Each measurement lasts 300 seconds. Test settings are 30%, 60% and 90%; corresponding comparison targets are 6, 12 and 18 L/h. Repeat the series at pump discharge pressures of 3 and 5 bar, approximately 43.5 and 72.5 psi. These targets are chosen for this example, not inferred as reliable output from the dial.
| Pressure / setting | Drawdown repeats, mL | Mean, L/h | Range, L/h | CV, % | Error, % |
|---|---|---|---|---|---|
| 3 bar / 30% | 470 / 480 / 490 | 5.76 | 5.64–5.88 | 2.08 | −4.00 |
| 3 bar / 60% | 980 / 1000 / 990 | 11.88 | 11.76–12.00 | 1.01 | −1.00 |
| 3 bar / 90% | 1480 / 1490 / 1500 | 17.88 | 17.76–18.00 | 0.67 | −0.67 |
| 5 bar / 30% | 440 / 450 / 460 | 5.40 | 5.28–5.52 | 2.22 | −10.00 |
| 5 bar / 60% | 920 / 930 / 940 | 11.16 | 11.04–11.28 | 1.08 | −7.00 |
| 5 bar / 90% | 1410 / 1420 / 1430 | 17.04 | 16.92–17.16 | 0.70 | −5.33 |
The mean is the sum of the three measured rates divided by three. The range lists the smallest and largest rates. CV = 100 × sample standard deviation / mean, using n − 1 in the sample-variance denominator. For the 5 bar, 60% point, the sample standard deviation is 0.12 L/h and CV is 1.08%. Good repeatability does not remove its −7% systematic shortfall.
Suppose this project requires an absolute mean error no greater than 5% and CV no greater than 3%, with the estimated measurement-error allowance also remaining inside the 5% band. All three 5 bar points fail the mean-error limit. At 3 bar, the 60% and 90% points have useful margin; the 30% point is close enough to the boundary to require a better measurement before acceptance. These are training decisions, not a universal fertilizer safety standard.
Plot setting on the horizontal axis and mean delivered L/h on the vertical axis, with a separate curve for each pressure and fluid condition. Retain the three individual readings or range bars. Connecting points is an interpolation aid; it does not establish a pump law. A curve at 3 bar cannot simply be transferred to a 5 bar zone.
At 5 bar, interpolation between the measured 60% and 90% points estimates the setting for 12 L/h as 60 + (12 − 11.16) × (90 − 60) / (17.04 − 11.16) = 64.3%. This differs slightly from the proportional 64.5% estimate because interpolation uses a measured local slope. Try a permitted nearby setting and remeasure; do not extrapolate below 30% or above 90% from these data.
For a hypothetical final check at 64.3%, drawdowns of 995, 1000 and 1005 mL in 300 seconds give 11.94, 12.00 and 12.06 L/h: mean 12.00, range 11.94–12.06, CV 0.50%, and mean error 0%. Use finer-resolution measurement for these 5 mL distinctions. Confirm the accepted setting in a longer run representative of operation, and record total stock use. If stable operation cannot be achieved, repair the cause before accepting a fitted curve.
A 10 mL scale read to an assumed ±5 mL at each endpoint gives a conservative ±10 mL allowance on their difference. At a 930 mL drawdown, that is 1.08%. An assumed ±1 second on a 300-second elapsed interval adds 0.33%; adding these relative allowances gives about 1.41% before vessel-calibration bias, pulsation and other effects. This is a simple worst-case estimate, not a statistical expanded uncertainty or a traceable calibration certificate.
At only 480 mL, the same volume allowance is 2.08%, giving approximately 2.42% with timing. The observed −4% error therefore lacks a clean margin inside a ±5% decision band. Increase the duration or improve the vessel resolution, while preserving suction head and capacity. Averaging repeats reduces some random variation; it does not remove a biased vessel scale.
For the final example, a suitable finer vessel might support an assumed ±5 mL total difference allowance at 1,000 mL, plus the same timing allowance: about 0.83% before other contributions. Document the complete budget before accepting the 5% project limit. Keep enough pump strokes in each timed interval; a short sample ending between pulses can make a stable pump appear erratic. Report sensible digits, not calculator precision.
Clean water can be useful for initial mechanical checks when the equipment procedure allows it. It does not automatically represent a cold or concentrated fertilizer. Viscosity changes suction losses and valve behavior; temperature can change viscosity, gas release and crystallization. Density matters when converting a weighed mass loss into volume: V = m / ρ, using density for the actual mixture and temperature.
Complete the final check with the approved actual fluid, or a qualified equivalent, when handling controls allow. Confirm stock-solution solubility and mixing compatibility before blaming the pump. A new zone, regulator, injection lance, elevation or check-valve restriction changes the operating point and may invalidate the earlier curve.
For flow-paced operation, also check irrigation flow-meter pulses and the pulse conversion. Correct mL per pump stroke multiplied by an incorrect water-meter signal still produces an incorrect proportional dose. Check behavior at the lowest and highest intended zone flows.
| Observed pattern | Possible cause | Next check |
|---|---|---|
| Consistently low output | Suction restriction, worn wet end or insufficient capacity at pressure | Inspect strainer and wetted parts; compare the actual duty with the approved range. |
| High output or delivery after stopping | Wrong control mode, siphoning or faulty valve | Stop dosing and inspect controls and the approved anti-siphon arrangement. |
| Wide scatter or visible bubbles | Air leak, poor priming, intermittent inlet exposure | Check joints, liquid level and degassing; repeat only after stable operation. |
| Pulsing meter display | Sampling interval too short or meter unsuitable for pulsating flow | Compare a longer timed volume and appropriate instrument averaging. |
| Gradual output drift | Wear, deposits, stock temperature or concentration change | Compare maintenance and batch records against earlier curves. |
| Strong pressure sensitivity | Changing zone resistance, valve load or pump limitation | Measure pump and injection-point pressure under the actual zone condition. |
| No suction | Closed valve, dry inlet, blocked foot valve or failed prime | Isolate safely and inspect the suction path using the equipment procedure. |
| Setting changes without output change | External control overriding the dial, dead band or mechanical fault | Verify active control mode and allowed range before further adjustment. |
| Record block | Information to enter |
|---|---|
| Identity and conditions | Date, operator, pump ID, zone, fluid/batch, concentration, temperature, tank level and suction lift |
| Duty and instruments | Target rate, control setting/mode, water flow, suction/discharge pressures and gauge locations, vessel ID/resolution/calibration and timer |
| Each repeat | Start volume, end volume, elapsed time, ΔV, calculated rate, bubbles or pressure changes |
| Decision | Mean, minimum/maximum, CV, target error, uncertainty allowance, agreed limits and pass/hold decision |
| Closure | Adjustment, repeated result, final verification, authorized setting/curve, reviewer and next calibration trigger |
Recalibrate after replacing a pump, diaphragm, tube, seal or check valve; after suction-line repair; after changing product or stock concentration; and after a material temperature or backpressure change. Include commissioning, long idle periods, unexplained dose or EC drift, and the site's scheduled quality checks. An interval belongs to a documented risk and maintenance plan, not a claim that every installation needs the same calendar.
Use personnel qualified for the pressurized chemical equipment involved. Follow the product safety data sheet, equipment instructions, required protective equipment and local chemigation/backflow requirements. Isolate electrical energy and pressure before changing connections. Use compatible hoses, contained vessels and an approved spill-response and disposal route; do not discharge hazardous solution onto soil or into a drain.
Restore the normal valve arrangement, verify required interlocks and backflow protection, check for leaks and confirm that dosing stops when required. Release the recorded setting only after the measured rate, repeatability and measurement margin meet the agreed rule. Pump calibration is then one verified step; mixed-water concentration and field distribution still need their own evidence.
Illustrative image adapted with AI from a Washington State University Extension pump-calibration photograph. Added equipment and arrangement are illustrative; the image is not an installation drawing or a record of the numerical test above.
Products relevant to this irrigation guide.
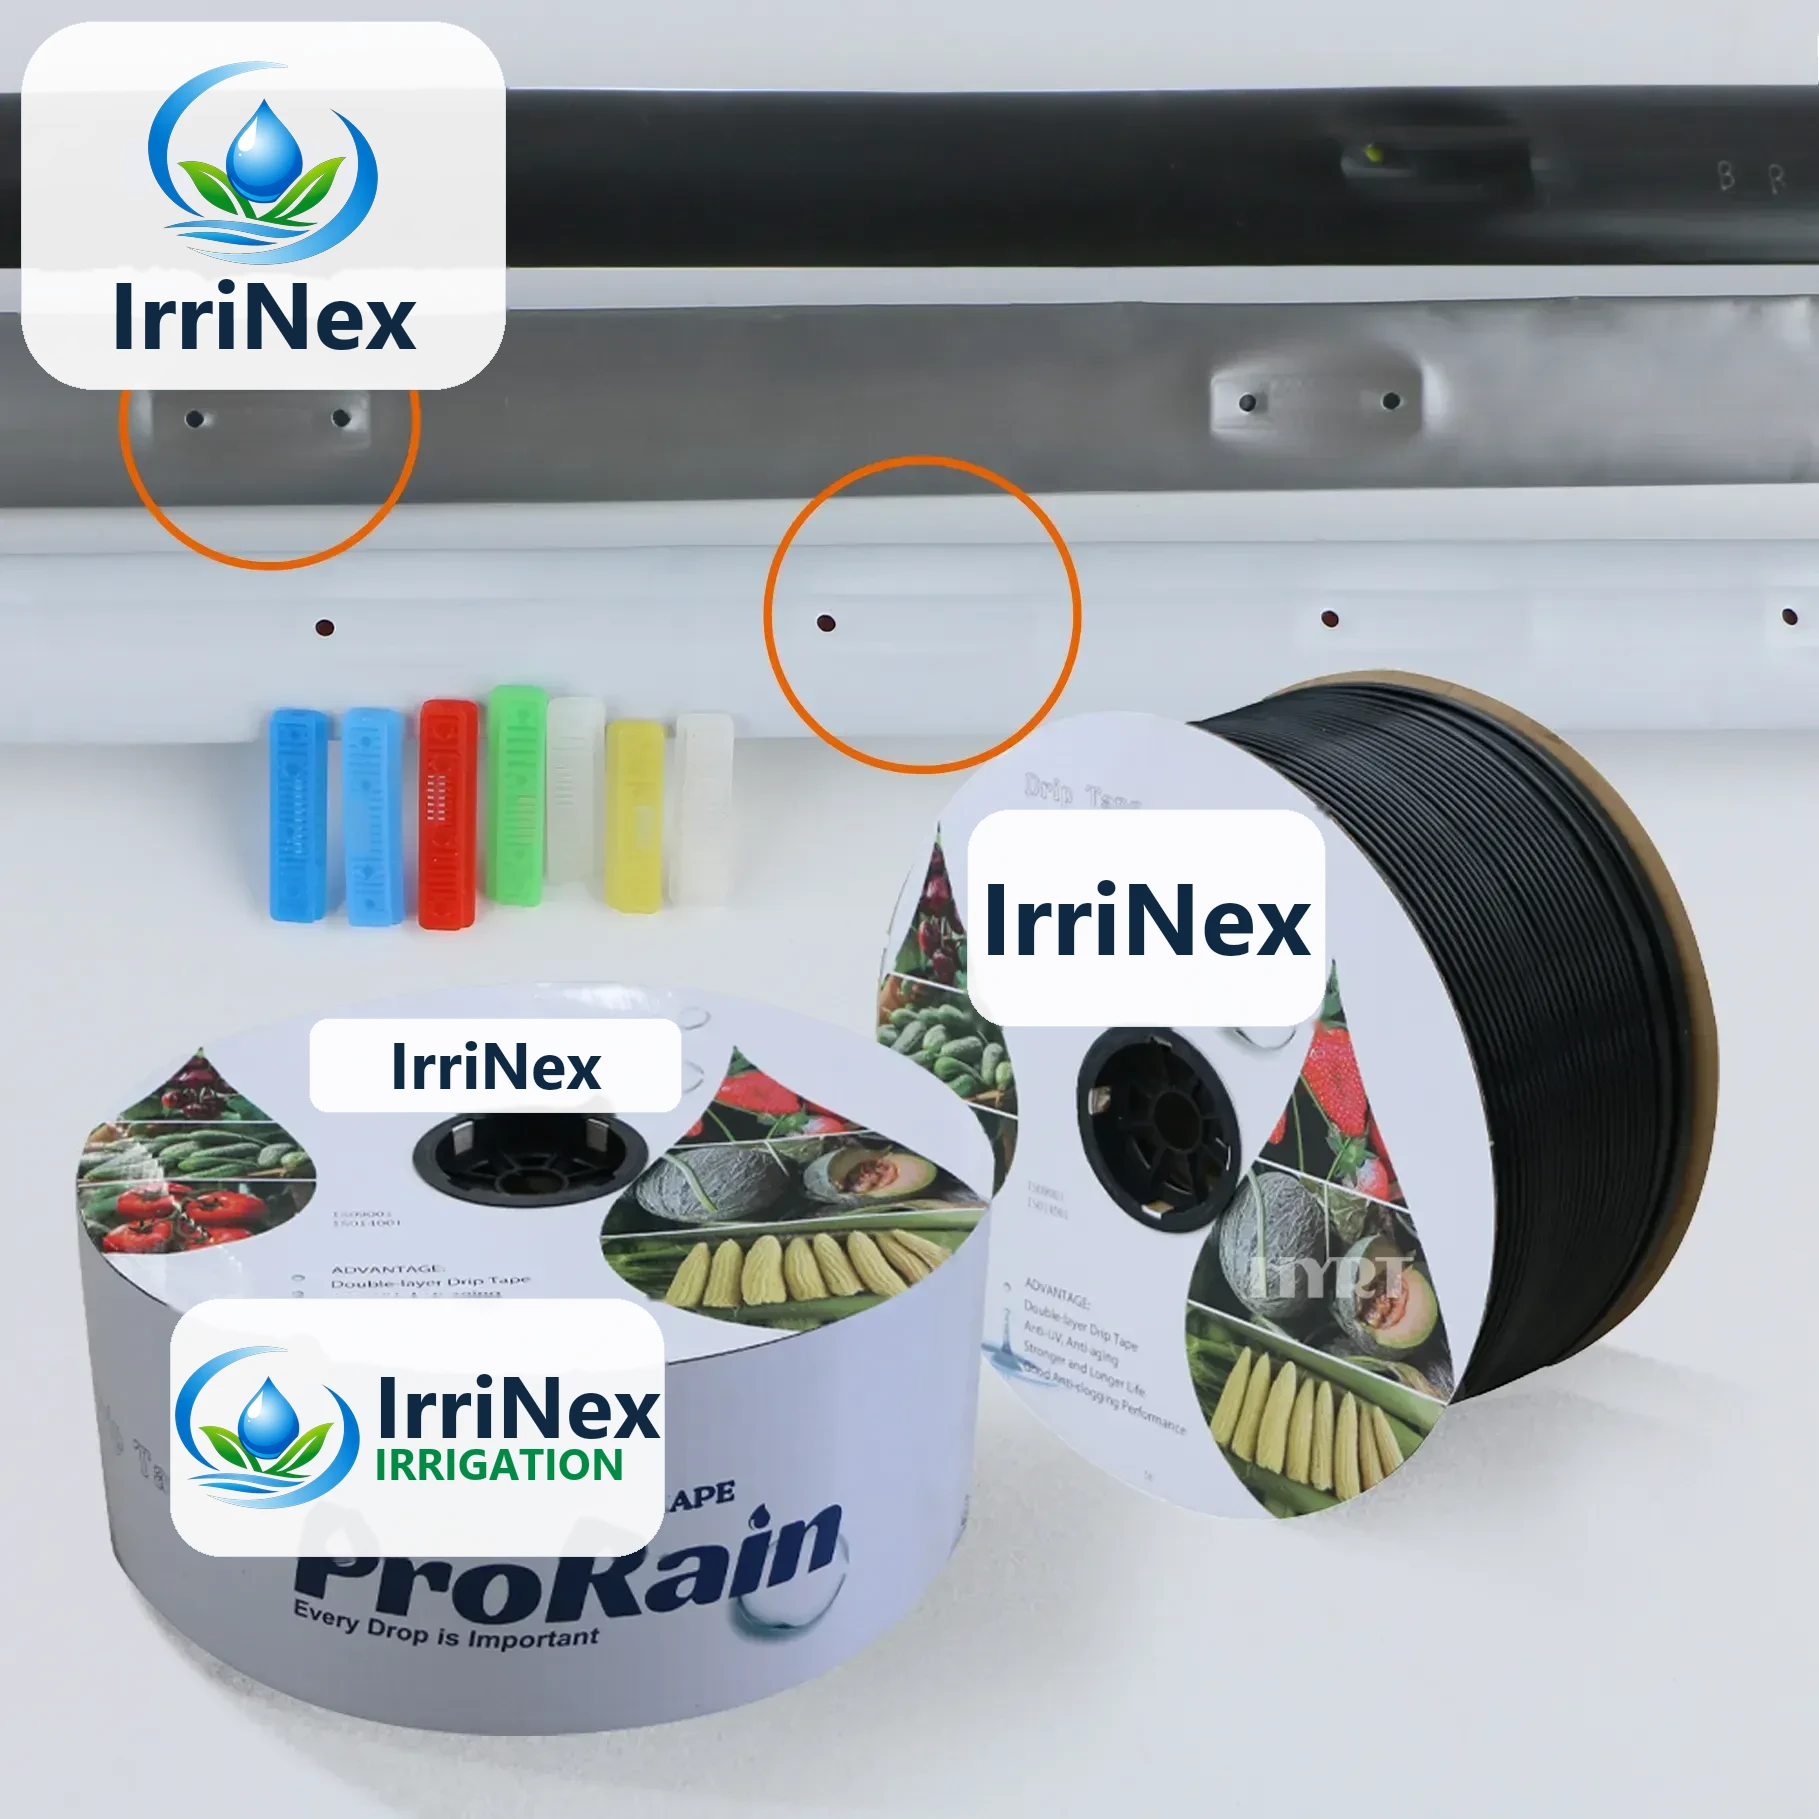
IRRINEX drip irrigation tape. Thickness: 0.2-0.6mm; Diameter: 16mm; Flow rate: 1.38-3L/H; Working pressure: 0.5Bar~2Bar. Drip tape forms a lateral watering component with a selected outlet arrangement. Diameter, wall thickness and emitter options should be checked as one exact configuration.

IRRINEX irrigation sprinkler. Flow rate: 300-500L/H; Working Pressure: 0.2-0.3mpa; Wet diameter: 10m-12m; Adapter size: 1/2". This sprinkler is a water-distribution component for a selected irrigation layout. Use the listing's named sprinkler form and exact operating data when comparing configurations.
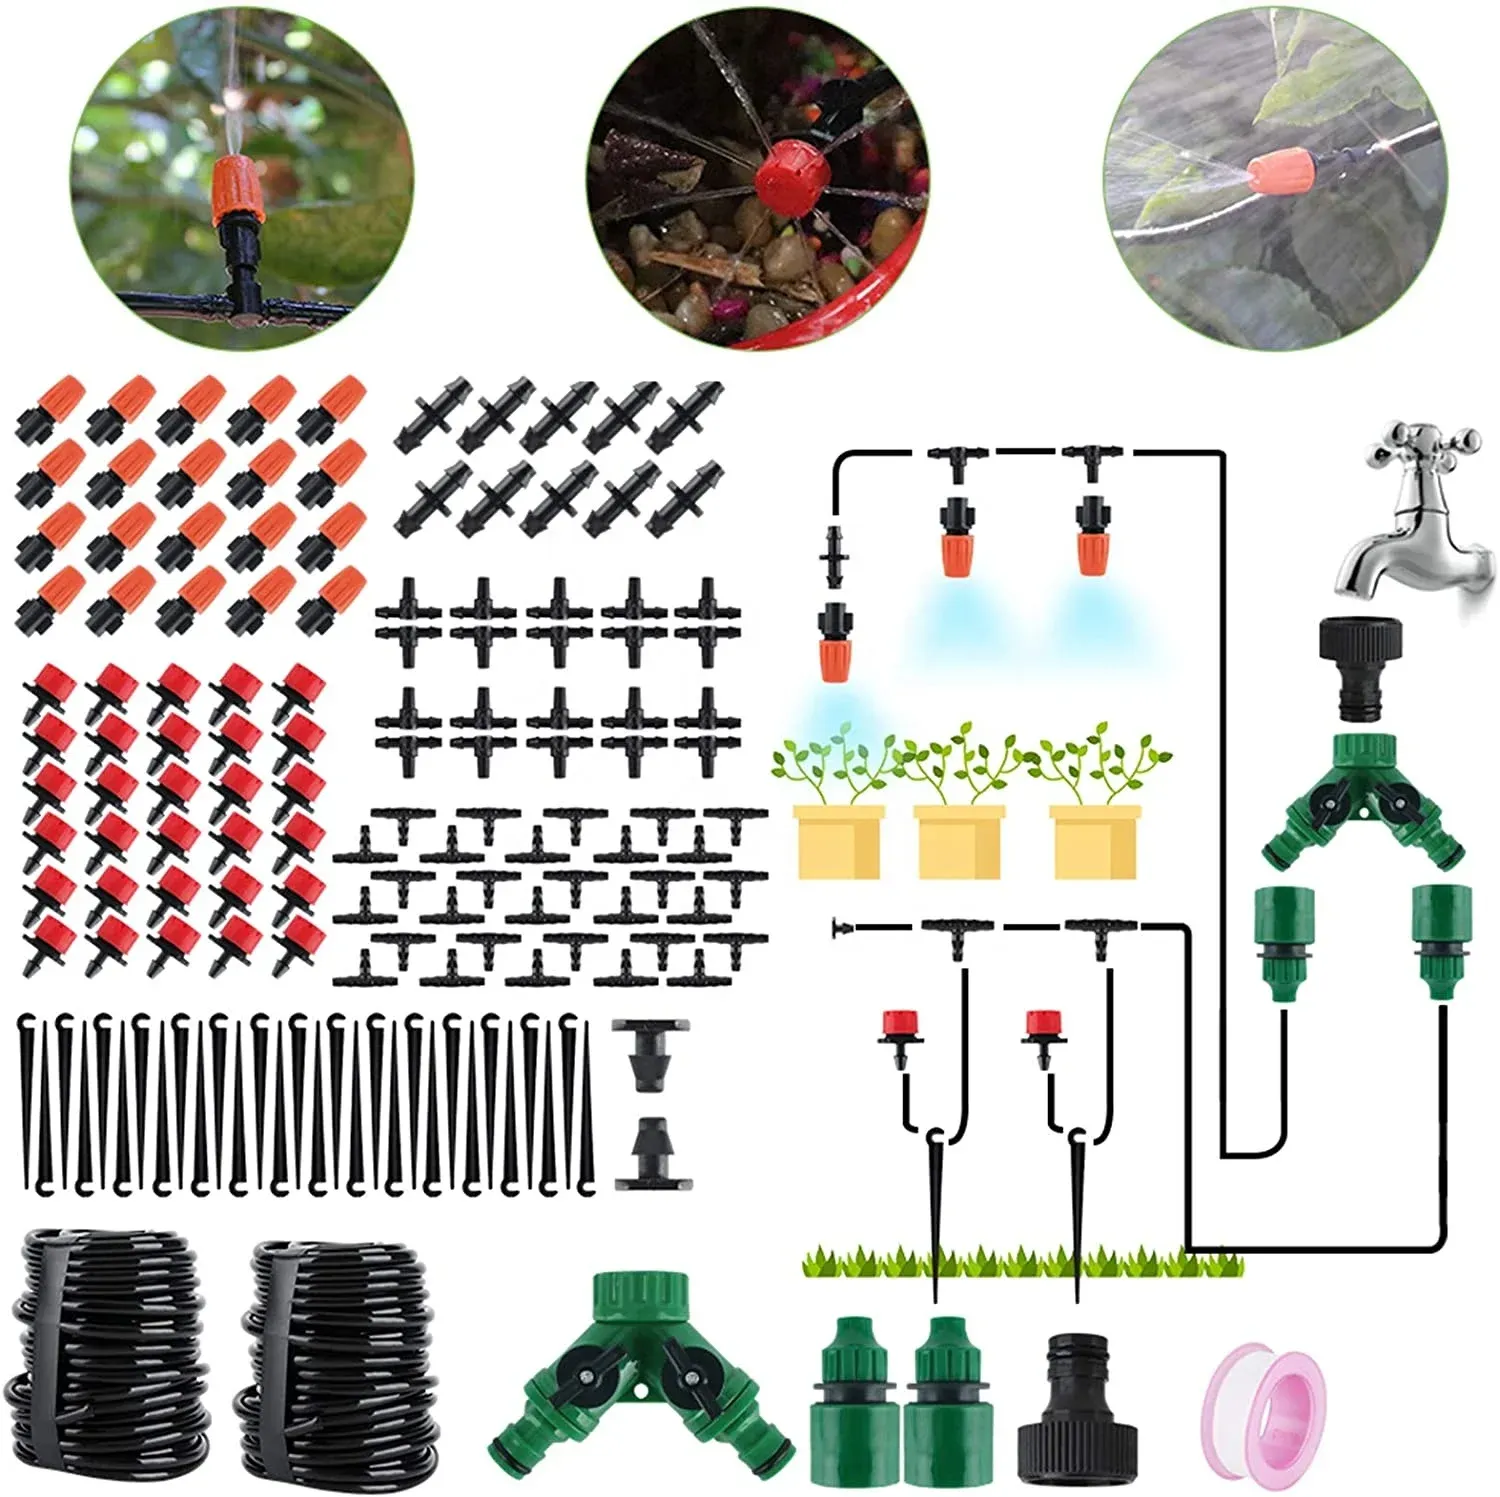
IRRINEX irrigation watering kit. Size: 30m/100FT; size: 23*23; Connection: ISO90012008. A watering kit groups components for a selected irrigation arrangement. Confirm the actual included parts and dimensions before matching the kit to a planting layout.
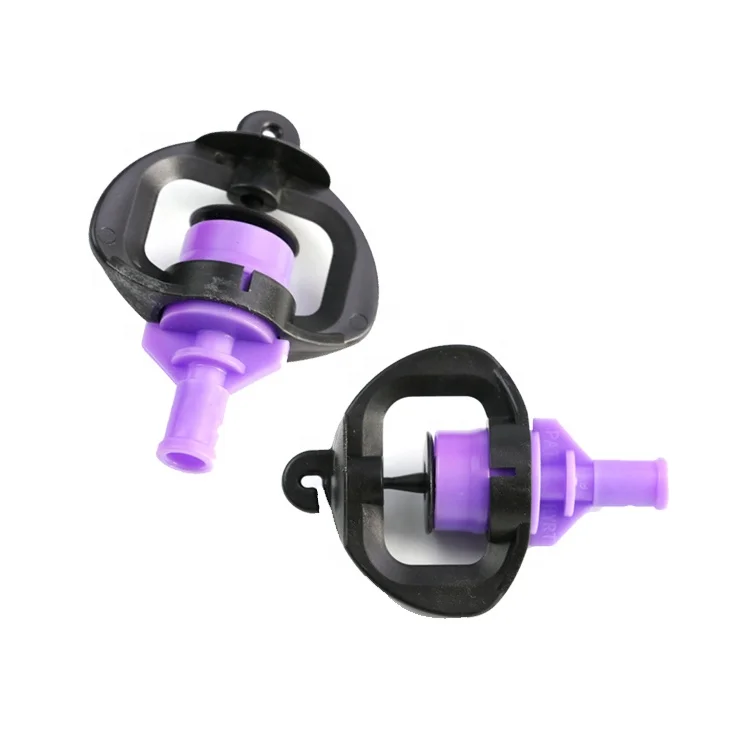
IRRINEX irrigation sprinkler. Spray radius: 3.0M-5.0M. This sprinkler is a water-distribution component for a selected irrigation layout. Use the listing's named sprinkler form and exact operating data when comparing configurations.