Air Release Valve Sizing: Match Air Capacity to Pipeline Filling Rate
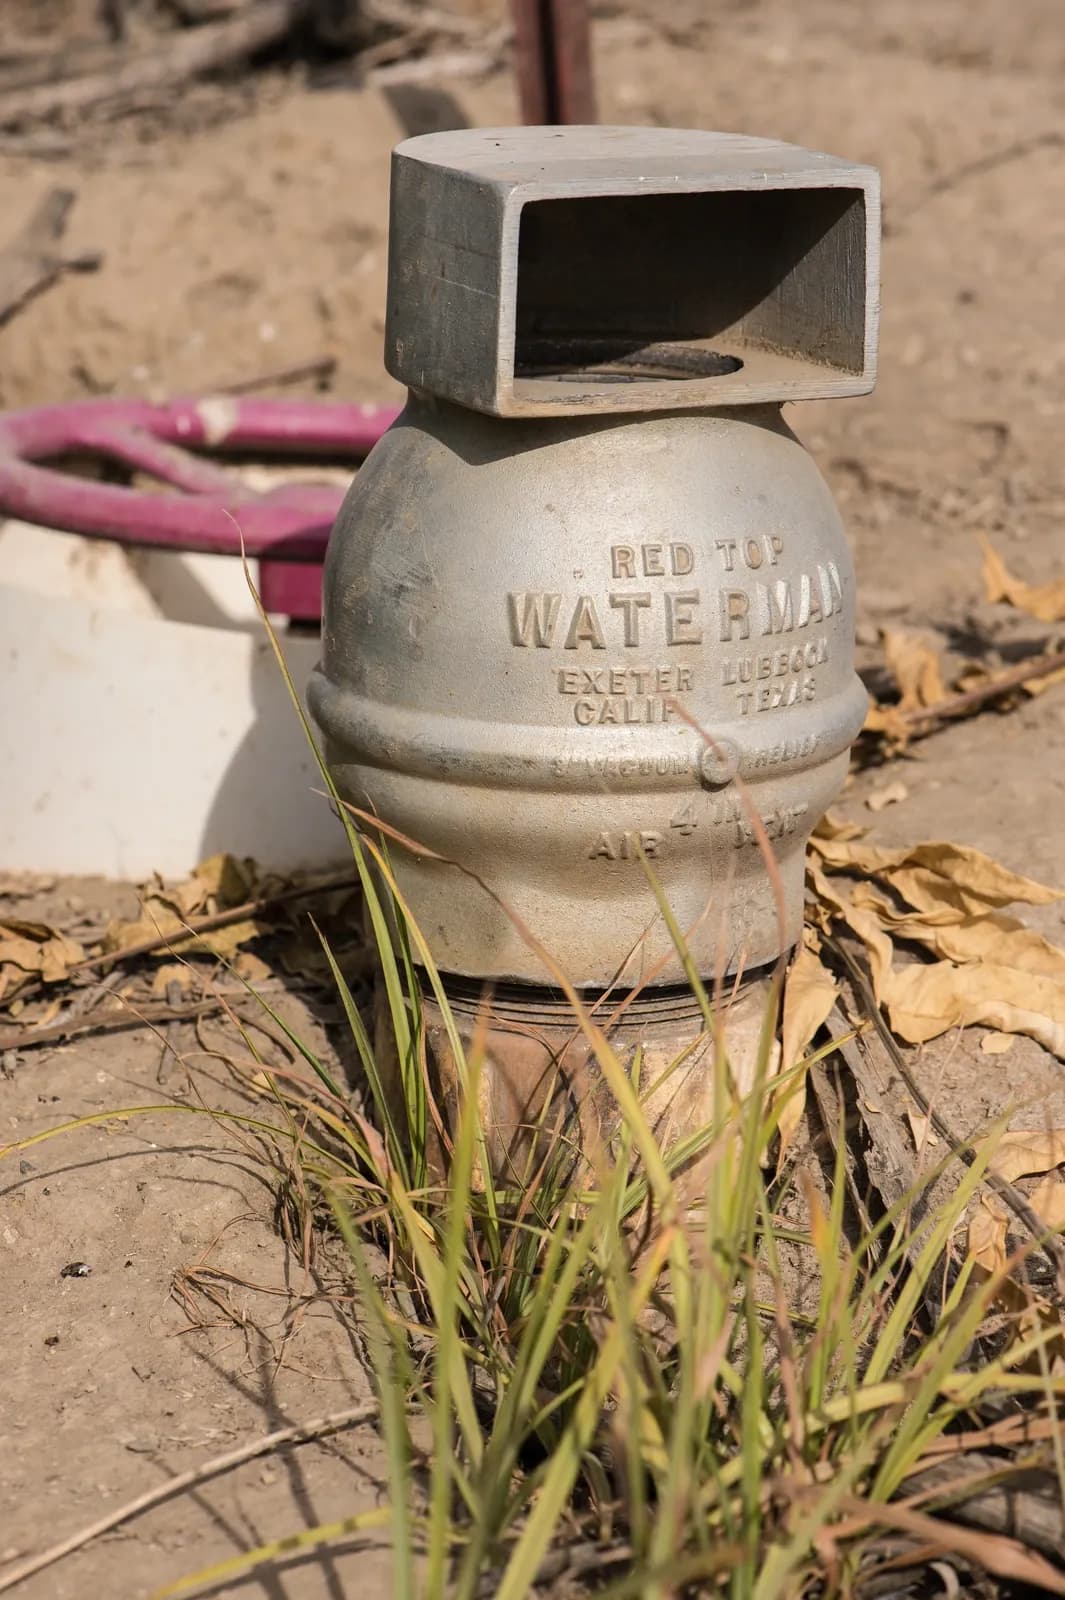
Air release valve sizing for pipeline filling starts with the water entering the empty section, the air-discharge path and the permitted pressure difference. Calculate the displaced air, put that demand on the same pressure and temperature basis as the supplier's capacity curve, and check the complete installed assembly. A connection diameter alone cannot establish filling capacity.
Irrigation air vent photographed near Yuba City, California. The photograph shows installed hardware; it does not establish the exhaust capacity or pressure limits used in this example. Photo: USDA/Lance Cheung.
This guide develops a filling-capacity worksheet for an agricultural irrigation pipeline. It does not select a commercial valve without its tested data. The worked example uses invented project inputs so that the calculations can be checked and replaced with field-specific values.
1. Specify filling exhaust as a separate duty
The USDA NRCS Irrigation Pipeline standard, November 2024, distinguishes bulk air discharge during filling, release during pressurized operation and air admission during drainage. Its national air-release criterion limits design exhaust differential pressure to 2 psi. That is a criterion within this document, not a universal valve rating; applicable local requirements and the actual pipeline still govern the project.
For each proposed air-valve location, write down which of those duties the assembly must perform. A capacity quoted for a small automatic orifice at normal irrigation pressure does not establish what the large exhaust path can pass during initial filling. Likewise, an intake curve describes the opposite direction of flow.
| Condition | Required direction or function | Evidence to request |
|---|---|---|
| Controlled pipeline filling | Air leaves the section as water enters | Exhaust curve and closing behavior for the fitted assembly |
| Stable pressurized irrigation | Accumulated air leaves through the operating release mechanism | Continuous-release capacity at the relevant working pressure |
| Drainage or a specified shutdown event | Air enters the affected section | Intake capacity and the separate vacuum or transient assessment |
Use the air-valve placement worksheet to establish which section each connection serves. Here, the question is how much air must pass through that available path. The quantity of valves on a farm cannot answer it.
2. Calculate the water front's displacement rate
For a straight circular pipe with a known internal diameter D, its internal area is A = πD²/4. If water advances through the full cross section at velocity v, the volume it occupies each second increases at Q = Av. Use metres and metres per second to obtain cubic metres per second, then multiply by 3,600 for cubic metres per hour.
This is a simplified advancing-front model. Assume a completely empty section, no water leaving through branches, and an air path that remains connected. Treat air pressure and temperature as approximately steady while calculating the exhaust duty. Under those assumptions, air leaves at approximately the water displacement rate when expressed at the air conditions inside that section. Compressing an air pocket instead of discharging it invalidates that simple equality during the compression interval.
Consider an illustrative pipe with a verified internal diameter of 0.160 m and length of 600 m. Its area is 0.020106 m² and its empty internal volume is about 12.06 m³. At an assumed controlled filling velocity of 0.40 m/s, the displacement rate is 0.008042 m³/s, or 28.95 m³/h. The ideal fill time is 600/0.40 = 1,500 seconds, or 25 minutes.
The 0.40 m/s value is an example input, not a recommended maximum. Determine the actual allowed filling sequence from the system design. Use the irrigation pipe dimension guide to distinguish internal diameter from the nominal connection name or outside diameter.
| Example case | Length and filling velocity | Empty pipe volume | Displacement rate | Ideal fill time |
|---|---|---|---|---|
| Base case | 600 m; 0.40 m/s | 12.06 m³ | 28.95 m³/h | 25 minutes |
| Same length, twice the velocity | 600 m; 0.80 m/s | 12.06 m³ | 57.91 m³/h | 12.5 minutes |
| Twice the length, original velocity | 1,200 m; 0.40 m/s | 24.13 m³ | 28.95 m³/h | 50 minutes |
Doubling length in this restricted example doubles the volume and time, while leaving the instantaneous displacement rate unchanged. A real longer route can introduce extra high points, resistance, changing filling flow and isolated pockets. Those changes require another model; the table does not establish that one vent can serve any pipeline length.
3. Identify which air reaches each exhaust point
A supply meter measures total water entering its measurement boundary. It does not automatically tell you the filling rate of one branch. Subtract independently established water leaving through open outlets and account for the distribution of water between simultaneously filling sections. Avoid assigning the entire pump discharge to every air valve, or dividing it equally without a hydraulic reason.
Map the air path as the water fronts advance. A low section that fills first can interrupt communication between two air pockets. An isolation valve can separate another section. Describe the relevant stages and identify which air valve serves each pocket during each stage. Where that sequence is uncertain, obtain the necessary hydraulic assessment before using a single steady displacement figure.
Filling flow can also change as elevation and resistance change. The rated irrigation flow is not necessarily the largest startup inflow. Review the permitted start sequence against the source characteristic and filling controls; the pump flow and total dynamic head guide explains the source-side quantities to establish.
The useful output is a maximum required exhaust rate for each defined filling stage, with its assumptions. Retain separate lines for stages that have different pressure boundaries. Do not hide an uncertain stage by averaging its demand across the whole 25-minute fill.
4. Put air demand and capacity on the same reference basis
A cubic metre of air at pipe conditions and a cubic metre at a stated reference condition can contain different masses. The NASA Glenn explanation of the ideal-gas equation relates pressure, volume, temperature and gas quantity. Applying that relationship to the same dry-air mass flow gives Qref = Qactual × (Pactual/Pref) × (Tref/Tactual), when ideal-gas behavior is an adequate approximation.
Use absolute pressure and kelvin temperature in that expression. A gauge pressure is relative to local atmosphere; it must not be substituted directly for absolute pressure. Also identify where the actual conditions apply: inside the pipe, at the valve inlet, or at another measurement point.
For the base example, assume the air inside the pipe is held at 110 kPa absolute and 303.15 K. Assume local atmosphere is 100 kPa absolute. The pipe-to-atmosphere differential is therefore 10 kPa. Define this example's reference condition explicitly as 101.325 kPa absolute and 293.15 K; it is not a claim that every supplier uses this reference.
Using the unrounded displacement result, Qref = 28.9529179 × (110/101.325) × (293.15/303.15) = 30.39 m³/h at that stated reference condition. The faster filling case requires 60.79 m³/h on the same basis. These figures describe the same respective air mass flows as the actual-volume figures; the conversion has not increased the physical water inflow.
Read every curve note before converting. Labels such as standard cubic metres per hour, normal cubic metres per hour, free air or SCFM require their specified reference conditions. A graph labeled only “m³/h” leaves a question for the supplier. If moisture, gas composition or non-ideal behavior materially affects the duty, the simple dry-air conversion is insufficient.
5. Read the fitted assembly's exhaust curve
Locate the exhaust curve for the exact orifice and installed options. Confirm its pressure axis, flow direction, air reference conditions and applicable operating range. Find the required reference flow on that curve and determine the pressure difference it requires. Alternatively, read available capacity at the valve's permitted pressure difference. Do not use a pressure rating printed on the body as a substitute for either axis.
The available pressure difference must cover the entire air route. In another hypothetical allocation, retain the example's 10 kPa pipe-to-atmosphere allowance and assume the riser, service connection and outlet arrangement together require 2 kPa at the design air mass flow. That leaves 8 kPa for the valve itself. The 2 kPa is an assumed, separately verified connection loss for this illustration; it is not a standard accessory allowance.
Compare a supplier's valve-only curve at 8 kPa, using the required 30.39 m³/h reference flow. Air density changes along the route, so do not reuse the pipe's actual-volume value at every component. A curve already tested for the complete fitted assembly may include some of those losses; identify that boundary to avoid counting them twice.
| Hypothetical submitted evidence | What the review establishes | Next decision |
|---|---|---|
| Capacity given only at 10 kPa, with the correct air reference | The quoted point does not establish capacity at 8 kPa | Request the applicable lower-differential curve or test data |
| 24 m³/h at 8 kPa, on the example's stated reference basis | Below the required 30.39 m³/h | Fails this filling-capacity screen |
| 36 m³/h at 8 kPa, on the example's stated reference basis | Above the required 30.39 m³/h | Passes only this numerical screen; other duties remain |
These three offers are invented to demonstrate evidence review; they are not product performance claims. A real selection needs the actual tested curve, assembly identity and project criteria. Do not extrapolate a curve beyond its plotted or documented range, especially through a change in valve operating state.
6. Check the transition from air exhaust to water arrival
Capacity while the exhaust path is open does not describe what happens when the water front reaches the valve. Ask how the selected mechanism closes, whether the documented operating conditions permit premature closure, and which accessories change its response. An anti-slam option, outlet fitting or different orifice can change the curve or transition being assessed.
A bigger opening is not automatically a better overall selection. The designer must reconcile the required filling exhaust, closing behavior and separate air-admission duty. A low filling differential does not prove that water arrival or a later shutdown produces an acceptable transient.
Record the exact configuration in the equipment schedule. Keep the large exhaust path, small operating-release mechanism and any restricted outlet distinguishable. An unspecified substitution can satisfy the same connection thread while changing the performance that justified the selection.
7. Turn the calculation into a controlled filling record
Prepare the allowed filling stages, valve states, measurement points and acceptance limits before commissioning. Verify the installed identity and air path against the reviewed drawing. Include a defined response to abnormal pressure, leakage or unexpected cessation of exhaust; do not open pressurized components to investigate during filling.
Record time, inflow and relevant local pressure during the approved sequence. Where a pulse-output water meter is used, the irrigation pulse-meter conversion guide helps check the count-to-volume calculation. Separately confirm that the instrument and installation can measure water correctly during the startup stage; an air-filled meter is not automatically a reliable water-flow reference.
A stopwatch comparison with 25 minutes is only a volume-balance check under the worked example's assumptions. It does not measure local maximum air pressure, prove that every pocket escaped or qualify a transient. Preserve any difference between the calculation and observations, including partial initial filling, open branches or varying source flow.
The completed record should connect each filling stage to its demand calculation, exact capacity evidence and observed conditions. That makes a later change in pumping rate, branch sequence or valve accessory a reason to review specific assumptions rather than simply repeating the original connection size.
8. Frequently asked questions
Can I select an air release valve from pipe diameter alone?
Pipe diameter helps calculate displacement and define the connection, but it does not establish the required filling flow, available pressure difference or tested air capacity. Document those quantities for the actual assembly.
Is normal irrigation pressure the pressure to use on the filling exhaust curve?
Not automatically. Use the defined filling-stage differential at the curve's measurement boundary. Normal operating pressure belongs to a different operating case, including the check of continuous air release.
Does passing the filling-capacity calculation prove vacuum protection?
No. Air admission has its own flow direction, pressure limit and affected pipe sections. Drainage, pump stops and relevant transient events require their separate assessment.